Nouvelle-Aquitaine
Nouvelle-Aquitaine has 6,113,384 residents in 12 départements and 4,305 communes. The median price per square metre ranges from €820/m² in Creuse to €3,520/m² in Gironde.
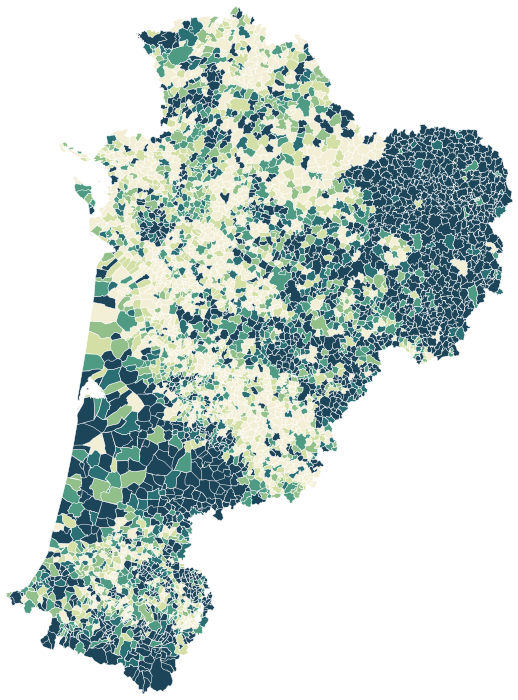
Sources: IGN and Insee, IRIS boundaries and Admin Express 2024 (Open Licence 2.0) · DGFiP property sales (DVF), data.gouv.fr statistics (Open Licence 2.0) · Insee, Filosofi 2021 income data (Open Licence 2.0) · © OpenStreetMap contributors (ODbL)
All 12 départements.
Colour shows where each département sits among the others in the region.
| Département | Residents | Communes | Price per m² | Living standard | Home owners | Aged 75+ | Unemployment | Second homes |
|---|---|---|---|---|---|---|---|---|
| Charente (16) | 351,603 | 362 | €1,430/m² | – | 67% | 13% | 11.4% | 6% |
| Charente-Maritime (17) | 668,160 | 463 | €2,790/m² | – | 66% | 14% | 11.5% | 22% |
| Corrèze (19) | 240,120 | 279 | €1,440/m² | – | 69% | 14% | 9.5% | 15% |
| Creuse (23) | 115,529 | 256 | €820/m² | – | 73% | 15% | 11.0% | 20% |
| Deux-Sèvres (79) | 375,415 | 256 | €1,370/m² | – | 70% | 12% | 8.8% | 5% |
| Dordogne (24) | 416,325 | 503 | €1,600/m² | – | 69% | 14% | 11.8% | 14% |
| Gironde (33) | 1,674,980 | 535 | €3,520/m² | – | 55% | 9% | 10.6% | 9% |
| Haute-Vienne (87) | 372,438 | 195 | €1,500/m² | – | 63% | 13% | 11.1% | 8% |
| Landes (40) | 428,427 | 327 | €2,690/m² | – | 67% | 12% | 11.1% | 20% |
| Lot-et-Garonne (47) | 332,226 | 319 | €1,530/m² | – | 65% | 14% | 11.8% | 6% |
| Pyrénées-Atlantiques (64) | 699,473 | 545 | €2,780/m² | – | 61% | 12% | 10.1% | 13% |
| Vienne (86) | 438,688 | 265 | €1,560/m² | – | 62% | 11% | 10.6% | 6% |
Sources: Insee, 2022 population census (sub-municipal files, Open Licence 2.0) · DGFiP property sales (DVF), data.gouv.fr statistics (Open Licence 2.0) · Insee, Filosofi 2021 income data (Open Licence 2.0)
People.
6,113,384 residents and 2,923,771 households at the 2022 census, next to the département figure.
Source: Insee, 2022 population census (sub-municipal files, Open Licence 2.0)
Homes.
3,664,327 homes, 80% of them main residences, with 4.2 rooms on average.
When main homes were built
Source: Insee, 2022 population census (sub-municipal files, Open Licence 2.0)
Income and work.
Work and qualifications at the 2022 census.
Sources: Insee, 2022 population census (sub-municipal files, Open Licence 2.0)
Départements in the region.
Every département has its own page, with all of its communes.