Auvergne-Rhône-Alpes
Auvergne-Rhône-Alpes has 8,163,884 residents in 12 départements and 4,027 communes. The median price per square metre ranges from €1,200/m² in Allier to €4,400/m² in Haute-Savoie.
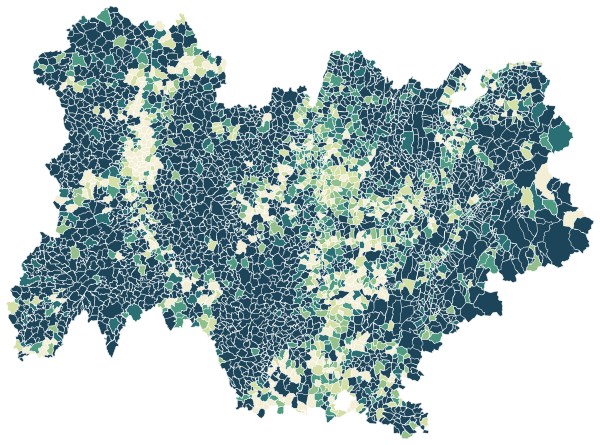
Sources: IGN and Insee, IRIS boundaries and Admin Express 2024 (Open Licence 2.0) · DGFiP property sales (DVF), data.gouv.fr statistics (Open Licence 2.0) · Insee, Filosofi 2021 income data (Open Licence 2.0) · © OpenStreetMap contributors (ODbL)
All 12 départements.
Colour shows where each département sits among the others in the region.
| Département | Residents | Communes | Price per m² | Living standard | Home owners | Aged 75+ | Unemployment | Second homes |
|---|---|---|---|---|---|---|---|---|
| Ain (01) | 671,289 | 392 | €2,620/m² | – | 63% | 9% | 8.9% | 6% |
| Allier (03) | 334,715 | 317 | €1,200/m² | – | 65% | 14% | 12.3% | 7% |
| Ardèche (07) | 333,229 | 335 | €1,970/m² | – | 67% | 12% | 11.4% | 18% |
| Cantal (15) | 144,399 | 246 | €1,280/m² | – | 71% | 14% | 6.9% | 21% |
| Drôme (26) | 521,432 | 363 | €2,250/m² | – | 62% | 11% | 11.8% | 8% |
| Haute-Loire (43) | 228,161 | 257 | €1,430/m² | – | 70% | 12% | 8.6% | 16% |
| Haute-Savoie (74) | 849,583 | 279 | €4,400/m² | – | 60% | 8% | 8.5% | 24% |
| Isère (38) | 1,291,380 | 512 | €2,710/m² | – | 61% | 9% | 9.5% | 8% |
| Loire (42) | 772,041 | 323 | €1,600/m² | – | 59% | 12% | 11.5% | 4% |
| Puy-de-Dôme (63) | 664,385 | 464 | €1,950/m² | – | 62% | 11% | 10.1% | 10% |
| Rhône (69) | 1,907,982 | 266 | €3,910/m² | – | 49% | 9% | 10.8% | 4% |
| Savoie (73) | 445,288 | 273 | €3,600/m² | – | 60% | 10% | 7.7% | 37% |
Sources: Insee, 2022 population census (sub-municipal files, Open Licence 2.0) · DGFiP property sales (DVF), data.gouv.fr statistics (Open Licence 2.0) · Insee, Filosofi 2021 income data (Open Licence 2.0)
People.
8,163,884 residents and 3,729,558 households at the 2022 census, next to the département figure.
Source: Insee, 2022 population census (sub-municipal files, Open Licence 2.0)
Homes.
4,671,276 homes, 80% of them main residences, with 4.0 rooms on average.
When main homes were built
Source: Insee, 2022 population census (sub-municipal files, Open Licence 2.0)
Income and work.
Work and qualifications at the 2022 census.
Sources: Insee, 2022 population census (sub-municipal files, Open Licence 2.0)
Départements in the region.
Every département has its own page, with all of its communes.