Finistère
Finistère has 927,912 residents in 277 communes. Over five years, homes sold for a median €2,130/m², from €1,110/m² in Plonévez-du-Faou to €3,560/m² in Bénodet among communes of more than 2,000 people. 69% of households own their main home.
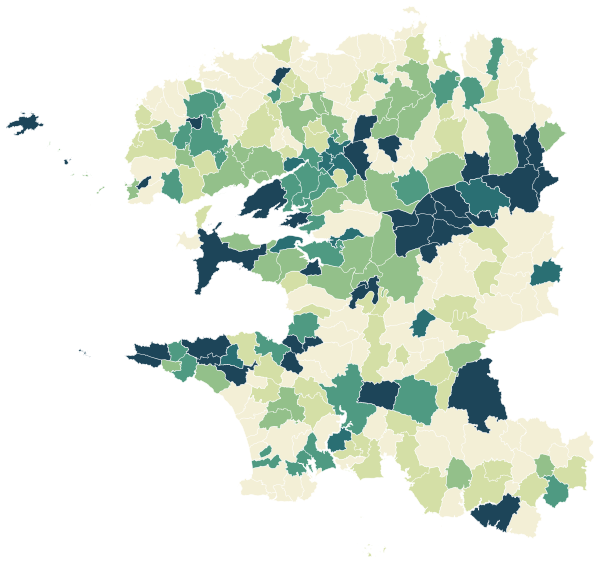
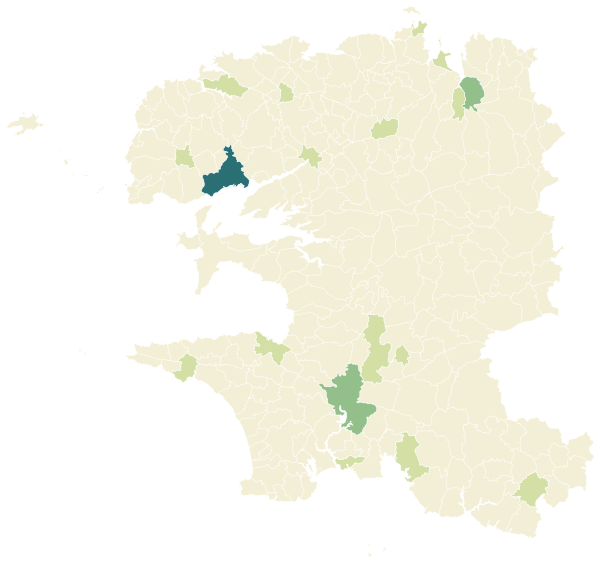
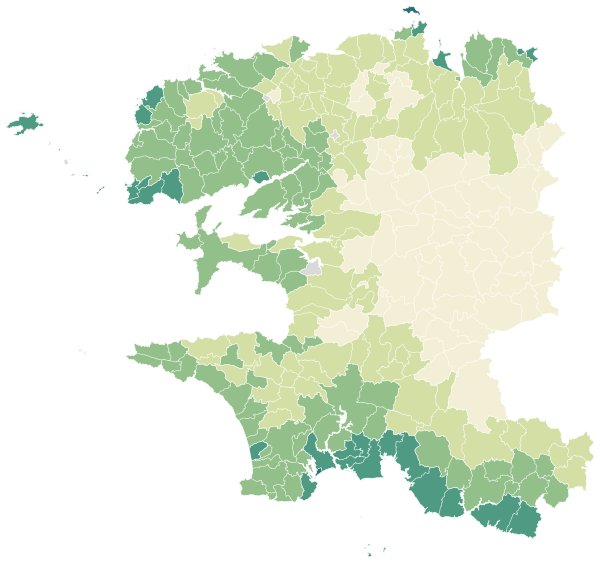
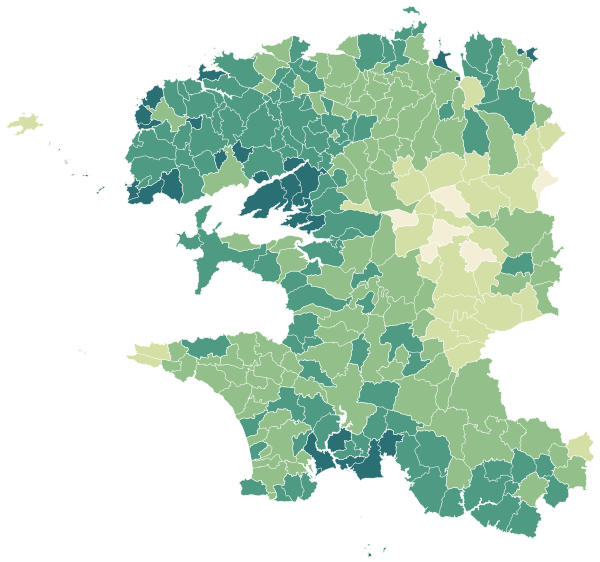
Four maps of Finistère.
Each commune is coloured by its value; every map uses the same colour scale, from lowest to highest. Grey: not published.
Sources: IGN and Insee, IRIS boundaries and Admin Express 2024 (Open Licence 2.0) · DGFiP property sales (DVF), data.gouv.fr statistics (Open Licence 2.0) · Insee, Filosofi 2021 income data (Open Licence 2.0) · © OpenStreetMap contributors (ODbL)
The 118 communes with more than 2,000 people.
Colour shows where each commune sits among the others in the table, from lowest to highest.
| Commune | Residents | Price per m² | Living standard | Home owners | Aged 75+ | Unemployment | Green 500 m | Services 15 min |
|---|---|---|---|---|---|---|---|---|
| Audierne | 3,708 | €2,430/m² | €22,370 | 78% | 21% | 14.8% | 21% | 82 |
| Bannalec | 5,707 | €1,820/m² | €22,010 | 78% | 10% | 10.6% | 0% | 33 |
| Bohars | 3,671 | €2,590/m² | €28,470 | 78% | 15% | 5.9% | 16% | 31 |
| Bourg-Blanc | 3,544 | €2,120/m² | €24,340 | 84% | 10% | 5.4% | 3% | 30 |
| Brest | 140,993 | €2,160/m² | €21,420 | 43% | 9% | 13.7% | 11% | 235 |
| Briec | 5,815 | €1,860/m² | €21,910 | 70% | 9% | 7.9% | 6% | 78 |
| Bénodet | 3,878 | €3,560/m² | €27,160 | 72% | 23% | 10.3% | 1% | 68 |
| Camaret-sur-Mer | 2,448 | €2,490/m² | €23,000 | 81% | 21% | 16.8% | 0% | 50 |
| Carantec | 3,261 | €3,150/m² | €27,360 | 77% | 20% | 9.7% | 9% | 63 |
| Carhaix-Plouguer | 7,326 | €1,290/m² | €21,180 | 61% | 17% | 13.5% | 29% | 15 |
| Châteaulin | 5,106 | €1,520/m² | €21,880 | 56% | 12% | 12.4% | 35% | 28 |
| Châteauneuf-du-Faou | 3,646 | €1,220/m² | €20,890 | 76% | 15% | 9.0% | 8% | 45 |
| Clohars-Carnoët | 4,701 | €3,210/m² | €25,420 | 81% | 14% | 10.8% | 2% | 24 |
| Clohars-Fouesnant | 2,152 | €2,790/m² | €24,820 | 80% | 11% | 9.6% | 8% | 7 |
| Cléder | 3,582 | €1,920/m² | €23,190 | 79% | 14% | 9.1% | 3% | 19 |
| Combrit | 4,271 | €3,030/m² | €26,210 | 83% | 14% | 8.7% | 18% | 20 |
| Concarneau | 20,632 | €3,120/m² | €23,590 | 61% | 16% | 13.6% | 7% | 63 |
| Crozon | 7,410 | €2,550/m² | €23,350 | 75% | 18% | 9.1% | 31% | 17 |
| Dirinon | 2,195 | €2,060/m² | €25,820 | 85% | 8% | 4.7% | 22% | 22 |
| Douarnenez | 14,188 | €2,190/m² | €22,000 | 64% | 17% | 15.3% | 22% | 89 |
| Edern | 2,199 | €1,720/m² | €23,250 | 82% | 7% | 5.6% | 1% | 14 |
| Elliant | 3,379 | €1,670/m² | €22,910 | 81% | 9% | 6.2% | 19% | 14 |
| Ergué-Gabéric | 8,576 | €2,040/m² | €24,500 | 77% | 10% | 6.2% | 36% | 4 |
| Fouesnant | 10,204 | €3,310/m² | €26,760 | 73% | 16% | 9.8% | 10% | 18 |
| Gouesnach | 2,765 | €2,630/m² | €25,550 | 86% | 9% | 9.2% | 24% | 13 |
| Gouesnou | 6,412 | €2,450/m² | €26,020 | 76% | 9% | 6.2% | 13% | 32 |
| Guiclan | 2,564 | €1,520/m² | €22,560 | 81% | 8% | 6.4% | 11% | 17 |
| Guilers | 8,221 | €2,270/m² | €24,640 | 77% | 13% | 7.2% | 5% | 47 |
| Guilvinec | 2,677 | €2,460/m² | €22,440 | 70% | 20% | 14.2% | 0% | 54 |
| Guipavas | 15,401 | €2,550/m² | €25,310 | 72% | 9% | 6.8% | 13% | 44 |
| Hanvec | 2,035 | €1,890/m² | €24,130 | 85% | 8% | 7.1% | 5% | 13 |
| Hôpital-Camfrout | 2,220 | €2,190/m² | €25,820 | 88% | 9% | 9.6% | 17% | 20 |
| Kerlouan | 2,028 | €1,980/m² | €22,300 | 83% | 17% | 9.4% | 8% | 23 |
| La Forêt-Fouesnant | 3,485 | €3,380/m² | €26,860 | 81% | 16% | 8.2% | 1% | 32 |
| Lampaul-Guimiliau | 2,004 | €1,440/m² | €22,710 | 83% | 7% | 8.9% | 30% | 12 |
| Lampaul-Plouarzel | 2,176 | €2,490/m² | €24,270 | 86% | 13% | 11.4% | 10% | 21 |
| Landerneau | 16,327 | €2,160/m² | €23,300 | 61% | 13% | 9.6% | 19% | 77 |
| Landivisiau | 9,197 | €1,700/m² | €21,800 | 62% | 10% | 12.0% | 14% | 75 |
| Landéda | 3,695 | €2,610/m² | €26,170 | 85% | 12% | 8.3% | 2% | 25 |
| Lanmeur | 2,367 | €1,870/m² | €22,720 | 76% | 21% | 9.7% | 3% | 24 |
| Lannilis | 5,712 | €2,140/m² | €23,200 | 75% | 11% | 6.7% | 1% | 68 |
| Le Conquet | 2,814 | €3,070/m² | €26,430 | 79% | 16% | 10.7% | 11% | 38 |
| Le Folgoët | 3,290 | €1,850/m² | €23,200 | 84% | 12% | 7.3% | 7% | 65 |
| Le Relecq-Kerhuon | 11,837 | €2,780/m² | €26,510 | 71% | 9% | 9.4% | 12% | 56 |
| Lesneven | 7,471 | €1,870/m² | €22,180 | 66% | 13% | 8.3% | 7% | 33 |
| Locmaria-Plouzané | 5,160 | €2,750/m² | €27,390 | 86% | 7% | 5.1% | 19% | 27 |
| Loctudy | 4,043 | €2,830/m² | €25,170 | 84% | 22% | 7.6% | 0% | 55 |
| Logonna-Daoulas | 2,127 | €2,220/m² | €25,940 | 85% | 10% | 7.3% | 37% | 22 |
| Loperhet | 3,952 | €2,410/m² | €26,590 | 83% | 8% | 7.5% | 20% | 37 |
| Melgven | 3,388 | €2,160/m² | €23,660 | 87% | 10% | 6.2% | 2% | 20 |
| Mellac | 3,371 | €2,270/m² | €23,760 | 82% | 8% | 6.7% | 4% | 16 |
| Milizac-Guipronvel | 4,733 | €2,320/m² | €24,450 | 85% | 7% | 4.1% | 17% | 7 |
| Morlaix | 15,220 | €1,540/m² | €20,930 | 51% | 11% | 17.3% | 19% | 107 |
| Moëlan-sur-Mer | 6,763 | €2,900/m² | €24,460 | 84% | 17% | 9.6% | 35% | 4 |
| Névez | 2,721 | €3,090/m² | €24,360 | 85% | 18% | 14.7% | 1% | 26 |
| Pencran | 2,229 | €2,210/m² | €24,330 | 88% | 5% | 6.1% | 28% | 10 |
| Penmarch | 5,320 | €2,540/m² | €23,090 | 84% | 19% | 11.5% | 1% | 24 |
| Plabennec | 8,633 | €2,250/m² | €24,230 | 77% | 8% | 5.6% | 7% | 12 |
| Pleuven | 3,298 | €2,910/m² | €24,630 | 80% | 11% | 9.7% | 8% | 11 |
| Pleyben | 3,649 | €1,420/m² | €21,890 | 72% | 11% | 7.0% | 10% | 56 |
| Pleyber-Christ | 3,175 | €1,560/m² | €22,200 | 76% | 11% | 11.8% | 9% | 36 |
| Plobannalec-Lesconil | 3,694 | €2,580/m² | €24,310 | 86% | 13% | 11.7% | 2% | 9 |
| Plogastel-Saint-Germain | 2,016 | €1,950/m² | €23,040 | 80% | 11% | 8.4% | 14% | 6 |
| Plogonnec | 3,223 | €1,910/m² | €22,750 | 82% | 11% | 6.1% | 2% | 24 |
| Plomelin | 4,216 | €2,360/m² | €25,190 | 79% | 11% | 8.3% | 0% | 27 |
| Plomeur | 3,877 | €2,310/m² | €22,860 | 86% | 10% | 9.4% | 0% | 27 |
| Plomodiern | 2,254 | €1,900/m² | €24,020 | 80% | 14% | 12.8% | 0% | 24 |
| Plonéis | 2,405 | €1,930/m² | €22,630 | 76% | 6% | 7.8% | 9% | 20 |
| Plonéour-Lanvern | 6,403 | €2,250/m² | €22,980 | 79% | 11% | 9.9% | 5% | 42 |
| Plonévez-du-Faou | 2,174 | €1,110/m² | €20,440 | 84% | 16% | 11.9% | 0% | 16 |
| Plouarzel | 3,987 | €2,560/m² | €25,070 | 82% | 8% | 8.0% | 9% | 27 |
| Ploudalmézeau | 6,440 | €2,380/m² | €24,030 | 82% | 14% | 6.1% | 3% | 52 |
| Ploudaniel | 3,738 | €1,860/m² | €23,710 | 82% | 9% | 5.7% | 14% | 27 |
| Plouescat | 3,549 | €1,850/m² | €22,360 | 77% | 16% | 12.2% | 1% | 44 |
| Plougasnou | 3,035 | €2,410/m² | €24,370 | 82% | 21% | 9.3% | 5% | 28 |
| Plougastel-Daoulas | 13,431 | €2,460/m² | €26,580 | 76% | 11% | 9.1% | 34% | 35 |
| Plougonvelin | 4,520 | €2,820/m² | €27,290 | 84% | 12% | 7.2% | 5% | 38 |
| Plougonven | 3,398 | €1,510/m² | €21,950 | 84% | 13% | 11.4% | 11% | 28 |
| Plouguerneau | 6,719 | €2,390/m² | €23,660 | 83% | 13% | 9.2% | 5% | 7 |
| Plouguin | 2,236 | €1,880/m² | €23,120 | 83% | 7% | 6.5% | 17% | 21 |
| Plouhinec | 3,923 | €2,290/m² | €22,770 | 86% | 20% | 11.7% | 11% | 17 |
| Plouigneau | 5,039 | €1,700/m² | €23,330 | 77% | 11% | 8.0% | 1% | 30 |
| Ploumoguer | 2,097 | €2,410/m² | €23,710 | 83% | 8% | 6.8% | 4% | 16 |
| Plounéventer | 2,212 | €1,630/m² | €23,140 | 83% | 6% | 5.6% | 12% | 15 |
| Plounévez-Lochrist | 2,285 | €1,510/m² | €21,590 | 81% | 10% | 8.9% | 3% | 17 |
| Plourin-lès-Morlaix | 4,529 | €1,750/m² | €23,290 | 75% | 14% | 9.8% | 4% | 28 |
| Plouvien | 3,930 | €2,070/m² | €23,960 | 81% | 6% | 5.8% | 3% | 37 |
| Plouvorn | 2,932 | €1,450/m² | €22,530 | 79% | 11% | 8.9% | 11% | 25 |
| Plouzané | 13,437 | €2,340/m² | €24,740 | 76% | 9% | 8.2% | 10% | 31 |
| Plouédern | 3,062 | €2,110/m² | €24,500 | 84% | 8% | 6.9% | 7% | 19 |
| Plouénan | 2,588 | €1,520/m² | €21,400 | 79% | 10% | 7.6% | 10% | 36 |
| Plozévet | 2,963 | €2,180/m² | €22,340 | 83% | 16% | 8.3% | 2% | 29 |
| Pluguffan | 4,229 | €2,300/m² | €23,630 | 75% | 9% | 7.7% | 5% | 33 |
| Pont-Aven | 2,796 | €2,370/m² | €22,690 | 74% | 21% | 11.7% | 14% | 40 |
| Pont-de-Buis-lès-Quimerch | 3,571 | €1,360/m² | €21,410 | 79% | 9% | 12.2% | 12% | 29 |
| Pont-l'Abbé | 8,403 | €2,340/m² | €22,870 | 64% | 16% | 13.7% | 16% | 46 |
| Pouldreuzic | 2,128 | €2,090/m² | €22,120 | 85% | 15% | 7.8% | 1% | 22 |
| Quimper | 64,530 | €2,130/m² | €22,700 | 55% | 11% | 12.9% | 21% | 108 |
| Quimperlé | 12,444 | €2,080/m² | €22,440 | 63% | 11% | 11.4% | 7% | 65 |
| Riec-sur-Bélon | 4,374 | €2,390/m² | €23,840 | 81% | 14% | 8.5% | 6% | 32 |
| Roscoff | 3,318 | €3,110/m² | €24,680 | 70% | 20% | 11.1% | 1% | 72 |
| Rosporden | 7,580 | €1,890/m² | €21,710 | 76% | 12% | 10.3% | 2% | 4 |
| Rédené | 2,999 | €2,370/m² | €24,380 | 84% | 8% | 5.8% | 22% | 20 |
| Saint-Martin-des-Champs | 4,792 | €1,670/m² | €22,200 | 70% | 16% | 11.2% | 2% | 90 |
| Saint-Pabu | 2,078 | €2,460/m² | €24,010 | 86% | 10% | 8.3% | 8% | 22 |
| Saint-Pol-de-Léon | 6,841 | €1,950/m² | €22,260 | 64% | 16% | 10.0% | 5% | 59 |
| Saint-Renan | 8,454 | €2,470/m² | €24,930 | 74% | 10% | 6.5% | 15% | 62 |
| Saint-Thégonnec Loc-Eguiner | 3,118 | €1,660/m² | €22,410 | 77% | 10% | 8.0% | 2% | 18 |
| Saint-Yvi | 3,418 | €1,950/m² | €23,430 | 81% | 8% | 8.5% | 5% | 24 |
| Saint-Évarzec | 3,491 | €2,450/m² | €24,800 | 84% | 8% | 7.0% | 1% | 23 |
| Santec | 2,435 | €2,660/m² | €24,840 | 83% | 10% | 9.0% | 1% | 11 |
| Scaër | 5,197 | €1,330/m² | €21,360 | 83% | 14% | 11.0% | 33% | 0 |
| Sizun | 2,334 | €1,380/m² | €21,890 | 77% | 10% | 9.8% | 12% | 44 |
| Taulé | 2,883 | €1,670/m² | €22,830 | 82% | 13% | 7.9% | 18% | 25 |
| Telgruc-sur-Mer | 2,145 | €2,420/m² | €24,020 | 82% | 13% | 10.0% | 13% | 26 |
| Treffiagat | 2,438 | €2,400/m² | €24,150 | 85% | 16% | 10.5% | 0% | 31 |
| Trégunc | 7,094 | €2,840/m² | €24,820 | 82% | 17% | 8.4% | 9% | 0 |
| Tréméven | 2,378 | €2,060/m² | €23,000 | 86% | 10% | 7.8% | 11% | 18 |
Sources: Insee, 2022 population census (sub-municipal files, Open Licence 2.0) · DGFiP property sales (DVF), data.gouv.fr statistics (Open Licence 2.0) · Insee, Filosofi 2021 income data (Open Licence 2.0) · © OpenStreetMap contributors (ODbL)
People.
927,912 residents and 446,160 households at the 2022 census, next to the département figure.
Source: Insee, 2022 population census (sub-municipal files, Open Licence 2.0)
Homes.
560,822 homes, 80% of them main residences, with 4.5 rooms on average.
When main homes were built
Source: Insee, 2022 population census (sub-municipal files, Open Licence 2.0)
Property prices.
69,390 house and flat sales over five years.
Median prices from sales published in France’s Demandes de valeurs foncières (DVF) over ten half-years, for sales of a single property. Individual sales are not shown. A median is only given where there were at least ten sales.
Source: DGFiP property sales (DVF), data.gouv.fr statistics (Open Licence 2.0)
Income and work.
Work and qualifications at the 2022 census.
Sources: Insee, 2022 population census (sub-municipal files, Open Licence 2.0)
Health, shops and services.
Facilities and services in Finistère on 1 January 2025, from Insee’s permanent database of facilities.
Insee’s permanent database of facilities lists the shops, services and health professionals present in each commune on 1 January. Health professionals in private practice are counted one by one; several may work at the same address.
Source: Insee, permanent database of facilities 2025 (Open Licence 2.0)
Natural and industrial hazards.
Share of the département’s 277 communes exposed to each major hazard, and natural-disaster declarations since 1982.
Natural-disaster declarations by type
A natural-disaster declaration (arrêté CatNat) lets insurers pay out for the damage. The count reflects past events, not a forecast of future risk. The list of hazards comes from each département’s major-risk file; a prevention plan in force limits building in exposed zones.
Source: Géorisques, GASPAR database (Open Licence 2.0), as of 5 October 2026