Gard
Gard has 764,010 residents in 351 communes. Over five years, homes sold for a median €2,480/m², from €980/m² in La Grand-Combe to €4,950/m² in Le Grau-du-Roi among communes of more than 2,000 people. 60% of households own their main home.
Four maps of Gard.
Each commune is coloured by its value; every map uses the same colour scale, from lowest to highest. Grey: not published.
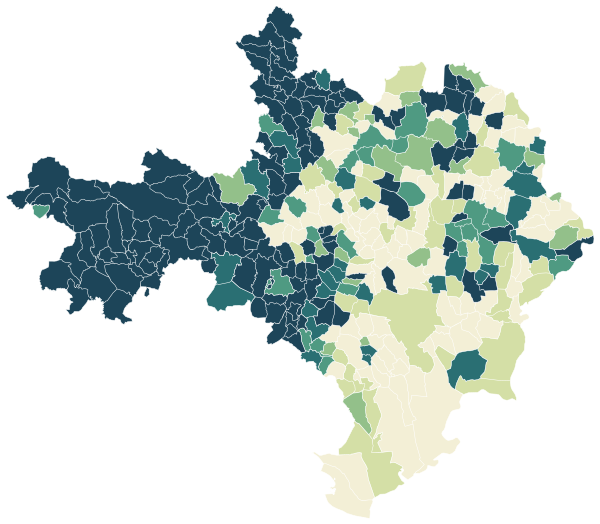
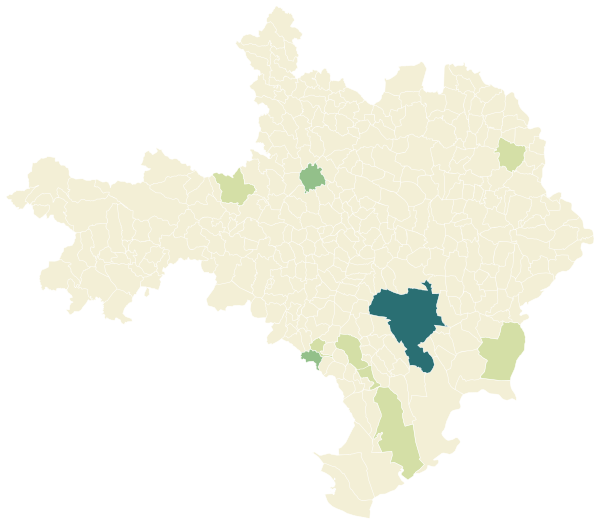
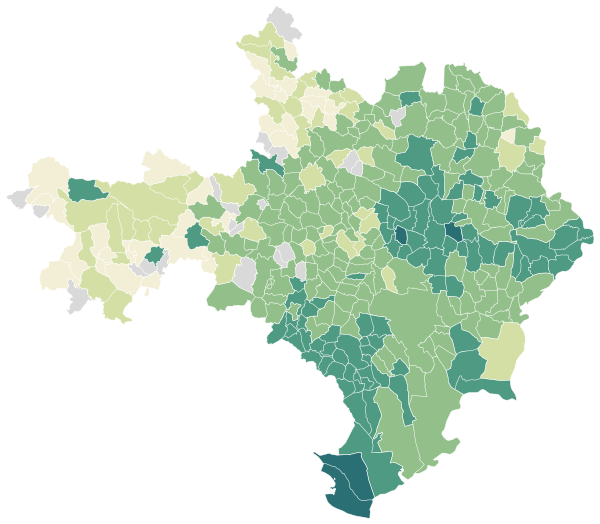
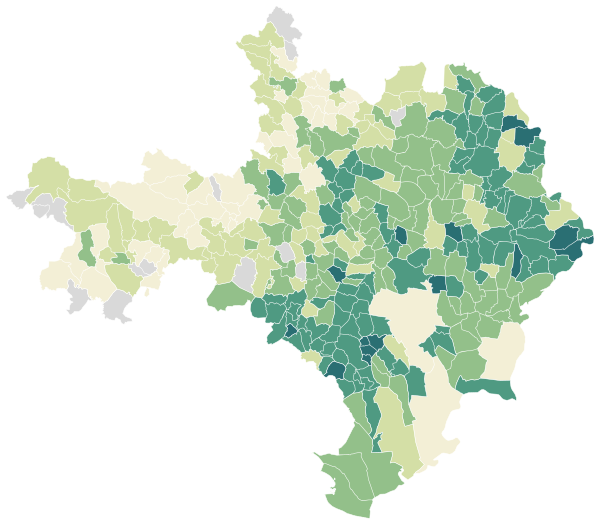
Sources: IGN and Insee, IRIS boundaries and Admin Express 2024 (Open Licence 2.0) · DGFiP property sales (DVF), data.gouv.fr statistics (Open Licence 2.0) · Insee, Filosofi 2021 income data (Open Licence 2.0) · © OpenStreetMap contributors (ODbL)
The 82 communes with more than 2,000 people.
Colour shows where each commune sits among the others in the table, from lowest to highest.
| Commune | Residents | Price per m² | Living standard | Home owners | Aged 75+ | Unemployment | Green 500 m | Services 15 min |
|---|---|---|---|---|---|---|---|---|
| Aigues-Mortes | 8,707 | €3,980/m² | €22,900 | 61% | 12% | 15.2% | 3% | 8 |
| Aigues-Vives | 3,340 | €3,030/m² | €25,370 | 74% | 10% | 8.7% | 9% | 33 |
| Aimargues | 5,806 | €3,020/m² | €22,540 | 66% | 7% | 12.9% | 10% | 50 |
| Alès | 45,025 | €1,740/m² | €18,000 | 39% | 14% | 23.8% | 9% | 109 |
| Anduze | 3,322 | €2,130/m² | €19,240 | 49% | 18% | 22.8% | 18% | 54 |
| Aramon | 4,082 | €2,400/m² | €22,560 | 59% | 11% | 11.7% | 5% | 33 |
| Aubais | 2,938 | €2,960/m² | €26,550 | 79% | 12% | 9.2% | 2% | 22 |
| Aubord | 2,296 | €2,730/m² | €24,550 | 78% | 10% | 9.7% | 0% | 25 |
| Bagard | 2,595 | €2,460/m² | €22,450 | 79% | 12% | 13.7% | 17% | 17 |
| Bagnols-sur-Cèze | 18,124 | €1,820/m² | €19,140 | 46% | 14% | 19.4% | 20% | 84 |
| Beaucaire | 15,695 | €1,620/m² | €18,300 | 52% | 11% | 18.5% | 5% | 62 |
| Beauvoisin | 5,823 | €2,810/m² | €22,300 | 71% | 6% | 9.6% | 0% | 27 |
| Bellegarde | 7,929 | €2,700/m² | €22,150 | 65% | 7% | 10.6% | 24% | 11 |
| Bernis | 3,341 | €2,690/m² | €23,200 | 72% | 13% | 10.2% | 2% | 27 |
| Bessèges | 2,624 | €1,130/m² | €16,700 | 49% | 22% | 27.3% | 37% | 24 |
| Bezouce | 2,341 | €2,350/m² | €22,380 | 69% | 9% | 10.3% | 2% | 24 |
| Boisset-et-Gaujac | 2,621 | €2,550/m² | €21,160 | 72% | 11% | 14.8% | 0% | 11 |
| Bouillargues | 6,119 | €2,660/m² | €24,000 | 72% | 12% | 10.4% | 0% | 20 |
| Caissargues | 4,077 | €2,670/m² | €24,320 | 69% | 13% | 12.9% | 0% | 38 |
| Calvisson | 6,295 | €3,030/m² | €24,680 | 67% | 9% | 9.1% | 5% | 68 |
| Caveirac | 4,328 | €3,060/m² | €25,330 | 73% | 12% | 10.2% | 1% | 19 |
| Clarensac | 4,257 | €2,860/m² | €24,940 | 77% | 7% | 8.4% | 0% | 35 |
| Codognan | 2,518 | €2,970/m² | €24,070 | 79% | 9% | 10.4% | 5% | 40 |
| Fourques | 2,701 | €2,750/m² | €23,590 | 66% | 10% | 11.1% | 8% | 35 |
| Gallargues-le-Montueux | 3,615 | €3,060/m² | €23,890 | 65% | 8% | 12.7% | 8% | 49 |
| Garons | 5,244 | €2,600/m² | €22,230 | 65% | 9% | 10.6% | 6% | 43 |
| Générac | 4,039 | €2,440/m² | €23,110 | 66% | 8% | 11.9% | 0% | 34 |
| Jonquières-Saint-Vincent | 3,886 | €2,460/m² | €21,460 | 66% | 8% | 13.6% | 1% | 25 |
| La Calmette | 2,572 | €2,470/m² | €21,630 | 61% | 9% | 15.5% | 0% | 26 |
| La Grand-Combe | 4,837 | €980/m² | €15,050 | 37% | 14% | 21.0% | 63% | 18 |
| Langlade | 2,297 | €3,260/m² | €27,220 | 85% | 13% | 6.7% | 0% | 23 |
| Laudun-l'Ardoise | 6,673 | €2,590/m² | €22,960 | 66% | 8% | 9.1% | 26% | 6 |
| Le Cailar | 2,566 | €2,950/m² | €23,320 | 72% | 11% | 8.3% | 8% | 24 |
| Le Grau-du-Roi | 8,513 | €4,950/m² | €21,870 | 60% | 22% | 16.5% | 0% | 24 |
| Le Vigan | 3,786 | €1,080/m² | €18,020 | 51% | 17% | 21.8% | 54% | 38 |
| Les Angles | 8,694 | €3,240/m² | €25,410 | 61% | 18% | 9.6% | 16% | 50 |
| Les Mages | 2,107 | €2,020/m² | €20,930 | 79% | 10% | 16.8% | 8% | 26 |
| Les Salles-du-Gardon | 2,403 | €1,160/m² | €16,820 | 50% | 17% | 19.0% | 29% | 28 |
| Manduel | 7,087 | €2,730/m² | €22,520 | 71% | 11% | 9.3% | 0% | 12 |
| Marguerittes | 8,370 | €2,540/m² | €22,560 | 72% | 13% | 11.6% | 4% | 58 |
| Meynes | 2,576 | €2,640/m² | €22,900 | 69% | 9% | 14.7% | 4% | 25 |
| Milhaud | 6,142 | €2,480/m² | €20,950 | 64% | 12% | 13.3% | 1% | 14 |
| Montfrin | 3,125 | €2,090/m² | €21,460 | 70% | 12% | 14.3% | 7% | 25 |
| Nages-et-Solorgues | 2,160 | €3,480/m² | €27,660 | 84% | 9% | 7.0% | 28% | 22 |
| Nîmes | 150,444 | €2,300/m² | €18,760 | 40% | 11% | 18.3% | 9% | 195 |
| Pont-Saint-Esprit | 10,759 | €1,710/m² | €20,330 | 58% | 13% | 16.9% | 9% | 22 |
| Poulx | 4,265 | €3,000/m² | €27,500 | 84% | 7% | 10.2% | 22% | 19 |
| Pujaut | 3,911 | €3,320/m² | €27,310 | 79% | 10% | 8.5% | 13% | 21 |
| Quissac | 3,449 | €2,510/m² | €21,020 | 61% | 12% | 11.5% | 20% | 57 |
| Redessan | 4,227 | €2,280/m² | €22,090 | 64% | 9% | 11.9% | 1% | 32 |
| Remoulins | 2,268 | €2,150/m² | €19,700 | 50% | 10% | 14.9% | 22% | 51 |
| Ribaute-les-Tavernes | 2,055 | €2,150/m² | €20,900 | 75% | 9% | 16.1% | 1% | 9 |
| Rochefort-du-Gard | 8,067 | €3,210/m² | €25,350 | 78% | 8% | 9.1% | 23% | 1 |
| Rodilhan | 2,810 | €2,650/m² | €23,140 | 66% | 12% | 11.8% | 1% | 21 |
| Roquemaure | 5,528 | €2,160/m² | €20,870 | 62% | 10% | 10.5% | 0% | 28 |
| Rousson | 4,437 | €2,300/m² | €21,900 | 81% | 9% | 12.3% | 3% | 28 |
| Saint-Ambroix | 3,353 | €1,730/m² | €18,170 | 54% | 18% | 32.7% | 11% | 38 |
| Saint-Chaptes | 2,030 | €2,460/m² | €21,770 | 65% | 10% | 12.1% | 0% | 31 |
| Saint-Christol-lez-Alès | 7,199 | €2,170/m² | €20,610 | 68% | 13% | 16.8% | 3% | 17 |
| Saint-Geniès-de-Comolas | 2,013 | €2,610/m² | €22,880 | 75% | 7% | 12.4% | 0% | 10 |
| Saint-Geniès-de-Malgoirès | 3,172 | €2,190/m² | €20,870 | 59% | 9% | 13.9% | 0% | 28 |
| Saint-Gilles | 14,427 | €2,170/m² | €18,590 | 55% | 9% | 17.5% | 0% | 27 |
| Saint-Hilaire-de-Brethmas | 4,643 | €2,260/m² | €22,250 | 75% | 12% | 12.7% | 0% | 9 |
| Saint-Hippolyte-du-Fort | 3,739 | €1,960/m² | €19,830 | 57% | 14% | 17.6% | 24% | 49 |
| Saint-Jean-du-Gard | 2,533 | €1,700/m² | €18,900 | 55% | 16% | 18.5% | 11% | 68 |
| Saint-Julien-les-Rosiers | 3,492 | €2,280/m² | €21,770 | 77% | 10% | 11.9% | 38% | 27 |
| Saint-Laurent-d'Aigouze | 3,651 | €3,200/m² | €22,770 | 71% | 10% | 8.8% | 5% | 29 |
| Saint-Laurent-des-Arbres | 2,984 | €2,920/m² | €25,430 | 80% | 7% | 7.0% | 3% | 16 |
| Saint-Martin-de-Valgalgues | 4,721 | €2,040/m² | €19,220 | 61% | 13% | 12.9% | 77% | 5 |
| Saint-Privat-des-Vieux | 5,592 | €2,300/m² | €23,120 | 76% | 13% | 11.5% | 13% | 17 |
| Saint-Quentin-la-Poterie | 3,110 | €3,100/m² | €22,830 | 72% | 16% | 10.3% | 8% | 28 |
| Saint-Victor-la-Coste | 2,222 | €2,730/m² | €24,790 | 78% | 10% | 9.7% | 27% | 15 |
| Salindres | 3,648 | €1,970/m² | €20,280 | 62% | 11% | 14.4% | 1% | 41 |
| Sauveterre | 2,013 | €2,960/m² | €24,680 | 74% | 8% | 9.0% | 10% | 14 |
| Saze | 2,097 | €2,920/m² | €24,560 | 74% | 9% | 9.6% | 10% | 19 |
| Sommières | 5,028 | €2,730/m² | €20,190 | 48% | 10% | 17.2% | 29% | 115 |
| Tavel | 2,032 | €2,600/m² | €24,260 | 73% | 9% | 7.8% | 2% | 28 |
| Uchaud | 4,824 | €2,580/m² | €21,440 | 64% | 9% | 12.9% | 0% | 26 |
| Uzès | 8,360 | €3,400/m² | €20,910 | 47% | 18% | 18.4% | 7% | 58 |
| Vauvert | 11,772 | €2,510/m² | €19,990 | 56% | 11% | 15.4% | 4% | 72 |
| Vergèze | 5,778 | €2,970/m² | €23,860 | 65% | 9% | 10.1% | 2% | 70 |
| Villeneuve-lès-Avignon | 12,950 | €3,570/m² | €27,590 | 66% | 15% | 9.8% | 31% | 53 |
Sources: Insee, 2022 population census (sub-municipal files, Open Licence 2.0) · DGFiP property sales (DVF), data.gouv.fr statistics (Open Licence 2.0) · Insee, Filosofi 2021 income data (Open Licence 2.0) · © OpenStreetMap contributors (ODbL)
People.
764,010 residents and 352,271 households at the 2022 census, next to the département figure.
Source: Insee, 2022 population census (sub-municipal files, Open Licence 2.0)
Homes.
446,619 homes, 79% of them main residences, with 4.0 rooms on average.
When main homes were built
Source: Insee, 2022 population census (sub-municipal files, Open Licence 2.0)
Property prices.
53,361 house and flat sales over five years.
Median prices from sales published in France’s Demandes de valeurs foncières (DVF) over ten half-years, for sales of a single property. Individual sales are not shown. A median is only given where there were at least ten sales.
Source: DGFiP property sales (DVF), data.gouv.fr statistics (Open Licence 2.0)
Income and work.
Work and qualifications at the 2022 census.
Sources: Insee, 2022 population census (sub-municipal files, Open Licence 2.0)
Health, shops and services.
Facilities and services in Gard on 1 January 2025, from Insee’s permanent database of facilities.
Insee’s permanent database of facilities lists the shops, services and health professionals present in each commune on 1 January. Health professionals in private practice are counted one by one; several may work at the same address.
Source: Insee, permanent database of facilities 2025 (Open Licence 2.0)
Natural and industrial hazards.
Share of the département’s 351 communes exposed to each major hazard, and natural-disaster declarations since 1982.
Natural-disaster declarations by type
A natural-disaster declaration (arrêté CatNat) lets insurers pay out for the damage. The count reflects past events, not a forecast of future risk. The list of hazards comes from each département’s major-risk file; a prevention plan in force limits building in exposed zones.
Source: Géorisques, GASPAR database (Open Licence 2.0), as of 5 October 2026