Haut-Rhin
Haut-Rhin has 767,800 residents in 366 communes. 61% of households own their main home.
Three maps of Haut-Rhin.
Each commune is coloured by its value; every map uses the same colour scale, from lowest to highest. Grey: not published.
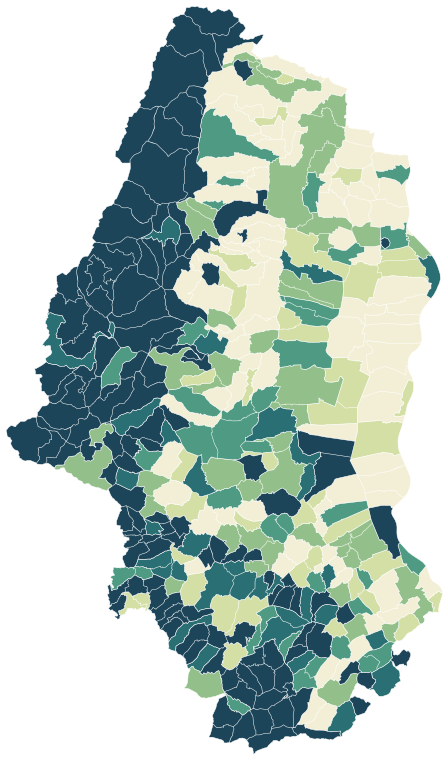
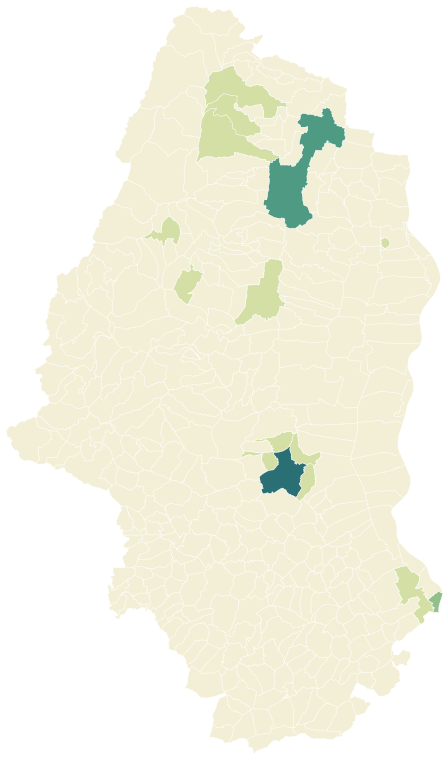
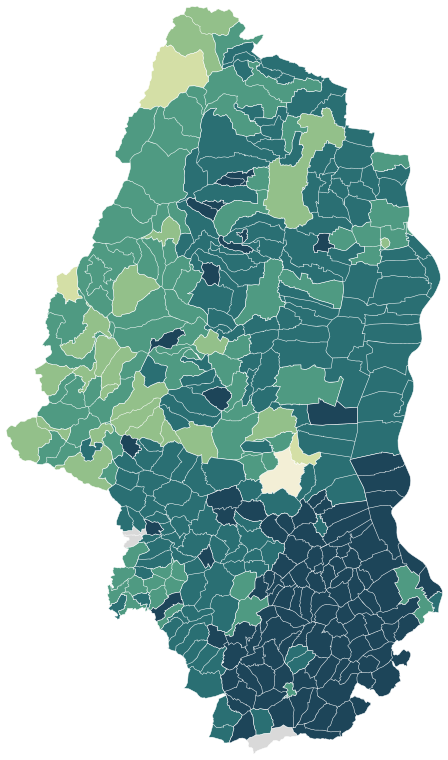
Sources: IGN and Insee, IRIS boundaries and Admin Express 2024 (Open Licence 2.0) · DGFiP property sales (DVF), data.gouv.fr statistics (Open Licence 2.0) · Insee, Filosofi 2021 income data (Open Licence 2.0) · © OpenStreetMap contributors (ODbL)
The 70 communes with more than 2,000 people.
Colour shows where each commune sits among the others in the table, from lowest to highest.
| Commune | Residents | Living standard | Home owners | Aged 75+ | Unemployment | Green 500 m | Services 15 min |
|---|---|---|---|---|---|---|---|
| Altkirch | 5,575 | €23,580 | 48% | 11% | 12.4% | 29% | 39 |
| Andolsheim | 2,196 | €28,900 | 84% | 9% | 6.9% | 0% | 11 |
| Baldersheim | 2,577 | €28,480 | 77% | 10% | 8.3% | 3% | 29 |
| Bartenheim | 4,135 | €34,410 | 72% | 7% | 8.8% | 7% | 33 |
| Bergheim | 2,061 | €25,450 | 71% | 14% | 6.9% | 11% | 28 |
| Biesheim | 2,519 | €25,040 | 67% | 9% | 10.4% | 4% | 46 |
| Blotzheim | 5,077 | €33,890 | 67% | 7% | 10.0% | 4% | 42 |
| Bollwiller | 4,104 | €23,900 | 65% | 10% | 12.2% | 3% | 24 |
| Brunstatt-Didenheim | 8,176 | €28,330 | 65% | 11% | 10.5% | 42% | 28 |
| Buhl | 3,122 | €23,360 | 66% | 9% | 8.1% | 17% | 23 |
| Carspach | 2,085 | €28,260 | 78% | 8% | 6.1% | 26% | 14 |
| Cernay | 11,737 | €22,130 | 53% | 9% | 10.7% | 16% | 47 |
| Colmar | 67,360 | €21,120 | 37% | 11% | 15.0% | 12% | 161 |
| Dannemarie | 2,258 | €23,110 | 54% | 14% | 13.8% | 13% | 38 |
| Ensisheim | 7,362 | €23,990 | 61% | 10% | 8.6% | 11% | 49 |
| Fessenheim | 2,335 | €26,870 | 65% | 6% | 9.2% | 0% | 38 |
| Guebwiller | 11,090 | €21,240 | 42% | 12% | 14.5% | 23% | 59 |
| Habsheim | 5,061 | €28,500 | 69% | 8% | 8.9% | 1% | 30 |
| Hirsingue | 2,131 | €24,940 | 61% | 11% | 11.9% | 8% | 34 |
| Hochstatt | 2,175 | €29,610 | 87% | 14% | 5.3% | 4% | 15 |
| Horbourg-Wihr | 6,247 | €25,580 | 63% | 12% | 7.0% | 19% | 15 |
| Houssen | 2,358 | €25,790 | 67% | 6% | 5.0% | 1% | 15 |
| Huningue | 7,410 | €25,540 | 44% | 8% | 15.1% | 8% | 132 |
| Hégenheim | 3,403 | €40,800 | 73% | 10% | 10.6% | 8% | 43 |
| Hésingue | 2,902 | €39,120 | 75% | 7% | 8.4% | 2% | 34 |
| Illfurth | 2,428 | €27,340 | 71% | 10% | 6.2% | 15% | 21 |
| Illzach | 15,115 | €20,570 | 57% | 9% | 15.5% | 24% | 65 |
| Ingersheim | 4,743 | €23,430 | 56% | 11% | 10.1% | 5% | 34 |
| Issenheim | 3,534 | €24,540 | 72% | 14% | 9.2% | 2% | 36 |
| Kaysersberg Vignoble | 4,391 | €25,560 | 63% | 13% | 7.5% | 19% | 67 |
| Kembs | 5,694 | €32,540 | 68% | 6% | 9.8% | 55% | 13 |
| Kingersheim | 13,265 | €23,170 | 66% | 11% | 12.8% | 14% | 65 |
| Labaroche | 2,174 | €27,610 | 87% | 9% | 4.1% | 41% | 18 |
| Lutterbach | 6,755 | €23,660 | 56% | 10% | 12.9% | 51% | 46 |
| Masevaux-Niederbruck | 3,615 | €22,640 | 59% | 14% | 13.0% | 13% | 56 |
| Meyenheim | 2,017 | €28,240 | 87% | 6% | 2.8% | 9% | 9 |
| Morschwiller-le-Bas | 3,666 | €27,010 | 71% | 9% | 9.8% | 13% | 32 |
| Mulhouse | 104,924 | €16,620 | 33% | 8% | 23.5% | 11% | 193 |
| Munster | 4,709 | €21,740 | 45% | 17% | 13.1% | 29% | 80 |
| Orbey | 3,445 | €24,070 | 69% | 13% | 8.0% | 55% | 41 |
| Ottmarsheim | 2,025 | €26,410 | 54% | 7% | 9.7% | 7% | 43 |
| Pfastatt | 10,275 | €23,270 | 60% | 11% | 13.4% | 6% | 61 |
| Pulversheim | 3,075 | €25,750 | 74% | 9% | 8.4% | 15% | 20 |
| Ribeauvillé | 4,723 | €24,150 | 52% | 14% | 11.5% | 2% | 88 |
| Richwiller | 3,786 | €25,850 | 72% | 12% | 9.3% | 22% | 23 |
| Riedisheim | 12,154 | €25,720 | 53% | 13% | 12.0% | 24% | 96 |
| Rixheim | 14,125 | €26,150 | 63% | 9% | 11.7% | 38% | 35 |
| Rosenau | 2,388 | €34,970 | 80% | 9% | 6.4% | 18% | 18 |
| Rouffach | 4,186 | €25,160 | 60% | 12% | 10.1% | 5% | 62 |
| Ruelisheim | 2,486 | €27,820 | 88% | 11% | 6.6% | 11% | 7 |
| Réguisheim | 2,036 | €26,020 | 74% | 8% | 8.0% | 16% | 10 |
| Saint-Amarin | 2,184 | €22,300 | 66% | 12% | 10.7% | 17% | 30 |
| Saint-Louis | 22,530 | €24,530 | 41% | 8% | 16.7% | 14% | 98 |
| Sainte-Croix-en-Plaine | 3,026 | €27,450 | 76% | 9% | 6.5% | 6% | 19 |
| Sainte-Marie-aux-Mines | 4,945 | €20,300 | 48% | 11% | 15.0% | 87% | 9 |
| Sausheim | 5,597 | €26,220 | 68% | 12% | 9.8% | 43% | 23 |
| Sierentz | 4,296 | €34,140 | 58% | 9% | 7.1% | 12% | 35 |
| Soultz-Haut-Rhin | 7,019 | €24,370 | 62% | 10% | 11.0% | 12% | 48 |
| Soultzmatt | 2,466 | €26,540 | 75% | 11% | 6.2% | 1% | 19 |
| Staffelfelden | 4,070 | €23,650 | 70% | 8% | 10.5% | 17% | 37 |
| Thann | 7,769 | €22,050 | 50% | 11% | 13.4% | 75% | 21 |
| Turckheim | 4,033 | €25,610 | 61% | 14% | 7.9% | 2% | 53 |
| Ungersheim | 2,440 | €27,410 | 77% | 6% | 6.1% | 0% | 9 |
| Vieux-Thann | 2,874 | €21,900 | 63% | 10% | 12.6% | 25% | 39 |
| Village-Neuf | 4,617 | €37,170 | 70% | 9% | 9.4% | 4% | 48 |
| Volgelsheim | 2,714 | €23,130 | 56% | 8% | 8.0% | 16% | 27 |
| Wintzenheim | 8,045 | €24,700 | 60% | 12% | 9.7% | 48% | 23 |
| Wittelsheim | 10,364 | €23,360 | 68% | 10% | 11.8% | 21% | 17 |
| Wittenheim | 15,491 | €22,170 | 64% | 10% | 13.6% | 25% | 36 |
| Zillisheim | 2,509 | €29,650 | 84% | 11% | 8.0% | 16% | 37 |
Sources: Insee, 2022 population census (sub-municipal files, Open Licence 2.0) · DGFiP property sales (DVF), data.gouv.fr statistics (Open Licence 2.0) · Insee, Filosofi 2021 income data (Open Licence 2.0) · © OpenStreetMap contributors (ODbL)
People.
767,800 residents and 343,977 households at the 2022 census, next to the département figure.
Source: Insee, 2022 population census (sub-municipal files, Open Licence 2.0)
Homes.
392,970 homes, 87% of them main residences, with 4.2 rooms on average.
When main homes were built
Source: Insee, 2022 population census (sub-municipal files, Open Licence 2.0)
Income and work.
Work and qualifications at the 2022 census.
Sources: Insee, 2022 population census (sub-municipal files, Open Licence 2.0)
Health, shops and services.
Facilities and services in Haut-Rhin on 1 January 2025, from Insee’s permanent database of facilities.
Insee’s permanent database of facilities lists the shops, services and health professionals present in each commune on 1 January. Health professionals in private practice are counted one by one; several may work at the same address.
Source: Insee, permanent database of facilities 2025 (Open Licence 2.0)
Natural and industrial hazards.
Share of the département’s 366 communes exposed to each major hazard, and natural-disaster declarations since 1982.
Natural-disaster declarations by type
A natural-disaster declaration (arrêté CatNat) lets insurers pay out for the damage. The count reflects past events, not a forecast of future risk. The list of hazards comes from each département’s major-risk file; a prevention plan in force limits building in exposed zones.
Source: Géorisques, GASPAR database (Open Licence 2.0), as of 5 October 2026