Marne
Marne has 564,107 residents in 611 communes. Over five years, homes sold for a median €2,130/m², from €960/m² in Sainte-Menehould to €3,770/m² in Bezannes among communes of more than 2,000 people. 52% of households own their main home.
Four maps of Marne.
Each commune is coloured by its value; every map uses the same colour scale, from lowest to highest. Grey: not published.
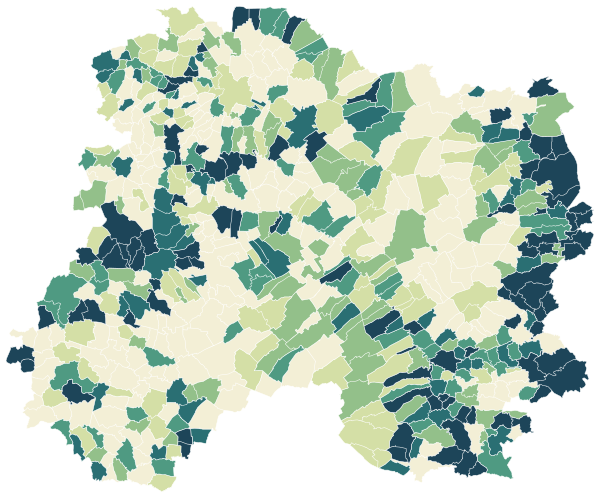
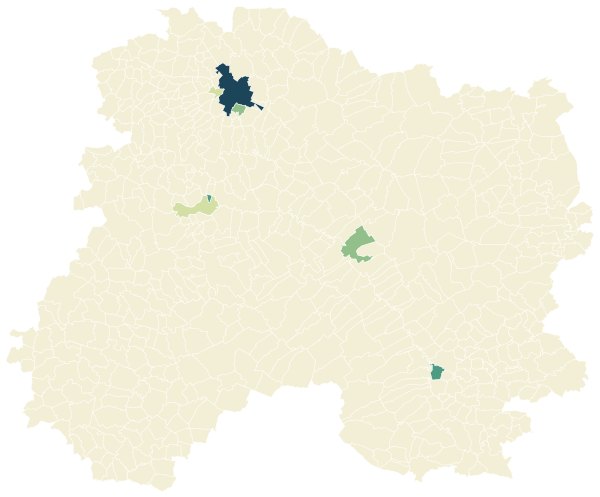
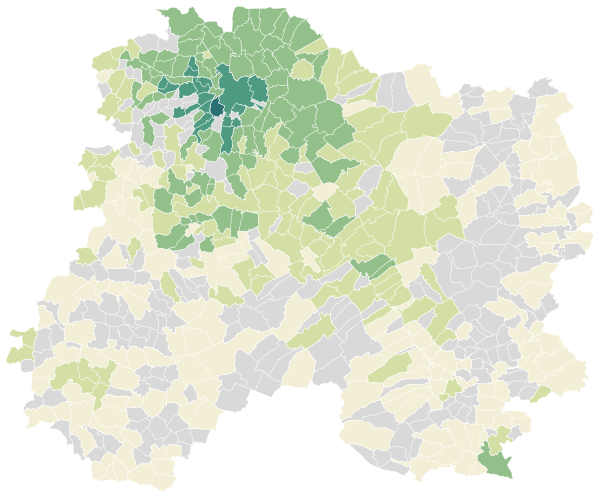
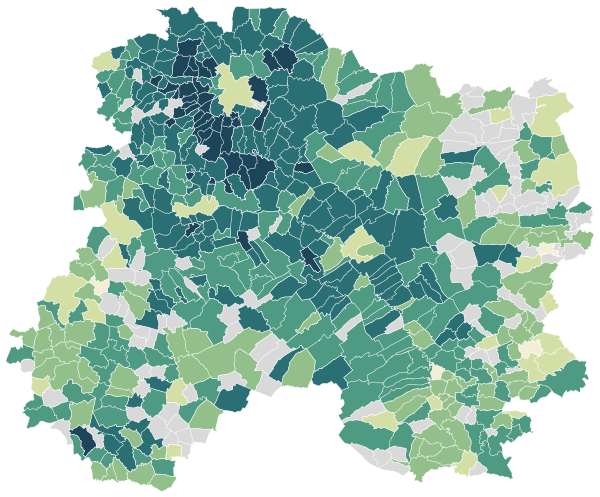
Sources: IGN and Insee, IRIS boundaries and Admin Express 2024 (Open Licence 2.0) · DGFiP property sales (DVF), data.gouv.fr statistics (Open Licence 2.0) · Insee, Filosofi 2021 income data (Open Licence 2.0) · © OpenStreetMap contributors (ODbL)
The 28 communes with more than 2,000 people.
Colour shows where each commune sits among the others in the table, from lowest to highest.
| Commune | Residents | Price per m² | Living standard | Home owners | Aged 75+ | Unemployment | Green 500 m | Services 15 min |
|---|---|---|---|---|---|---|---|---|
| Aÿ-Champagne | 5,148 | €1,880/m² | €24,360 | 62% | 14% | 9.6% | 2% | 30 |
| Bazancourt | 2,441 | €2,160/m² | €23,090 | 68% | 7% | 7.8% | 21% | 18 |
| Bezannes | 4,456 | €3,770/m² | €26,270 | 40% | 9% | 6.8% | 20% | 46 |
| Blancs-Coteaux | 3,120 | €1,480/m² | €25,390 | 74% | 15% | 6.7% | 0% | 16 |
| Bétheny | 7,030 | €2,510/m² | €24,450 | 67% | 12% | 8.2% | 2% | 31 |
| Châlons-en-Champagne | 43,218 | €1,540/m² | €20,320 | 37% | 10% | 15.5% | 7% | 107 |
| Cormontreuil | 6,454 | €2,950/m² | €26,120 | 68% | 16% | 8.5% | 3% | 120 |
| Courtisols | 2,345 | €1,790/m² | €25,780 | 81% | 9% | 6.5% | 14% | 26 |
| Dormans | 2,898 | €1,650/m² | €21,850 | 57% | 14% | 12.9% | 12% | 50 |
| Fagnières | 4,886 | €1,810/m² | €22,390 | 79% | 9% | 10.8% | 0% | 14 |
| Fismes | 5,884 | €1,700/m² | €20,690 | 47% | 11% | 11.4% | 29% | 25 |
| Fère-Champenoise | 2,181 | €1,060/m² | €21,310 | 64% | 10% | 12.0% | 2% | 22 |
| Montmirail | 3,551 | €1,420/m² | €20,590 | 54% | 16% | 14.1% | 20% | 40 |
| Mourmelon-le-Grand | 4,984 | €1,720/m² | €20,570 | 44% | 5% | 6.5% | 7% | 42 |
| Muizon | 2,072 | €2,340/m² | €26,340 | 70% | 10% | 7.2% | 34% | 28 |
| Reims | 178,478 | €2,740/m² | €20,210 | 28% | 8% | 16.8% | 9% | 282 |
| Saint-Brice-Courcelles | 3,546 | €2,640/m² | €23,260 | 53% | 9% | 9.2% | 10% | 40 |
| Saint-Memmie | 5,439 | €1,670/m² | €21,130 | 43% | 12% | 13.5% | 1% | 24 |
| Sainte-Menehould | 4,166 | €960/m² | €20,700 | 52% | 17% | 12.4% | 72% | 7 |
| Sarry | 2,028 | €2,020/m² | €27,700 | 86% | 11% | 5.3% | 12% | 22 |
| Suippes | 3,898 | €1,300/m² | €20,090 | 52% | 7% | 8.6% | 7% | 44 |
| Sézanne | 4,679 | €1,350/m² | €21,260 | 52% | 16% | 14.4% | 4% | 18 |
| Taissy | 2,202 | €2,670/m² | €28,970 | 85% | 10% | 7.0% | 17% | 24 |
| Tinqueux | 10,662 | €2,570/m² | €23,810 | 51% | 10% | 9.6% | 6% | 97 |
| Vitry-le-François | 11,349 | €1,090/m² | €17,890 | 31% | 13% | 20.7% | 20% | 147 |
| Warmeriville | 2,689 | €2,240/m² | €25,590 | 84% | 4% | 6.4% | 13% | 30 |
| Witry-lès-Reims | 4,958 | €2,420/m² | €24,990 | 56% | 6% | 7.0% | 2% | 32 |
| Épernay | 22,022 | €1,880/m² | €20,590 | 43% | 12% | 16.2% | 10% | 90 |
Sources: Insee, 2022 population census (sub-municipal files, Open Licence 2.0) · DGFiP property sales (DVF), data.gouv.fr statistics (Open Licence 2.0) · Insee, Filosofi 2021 income data (Open Licence 2.0) · © OpenStreetMap contributors (ODbL)
People.
564,107 residents and 264,831 households at the 2022 census, next to the département figure.
Source: Insee, 2022 population census (sub-municipal files, Open Licence 2.0)
Homes.
302,456 homes, 88% of them main residences, with 4.2 rooms on average.
When main homes were built
Source: Insee, 2022 population census (sub-municipal files, Open Licence 2.0)
Property prices.
35,313 house and flat sales over five years.
Median prices from sales published in France’s Demandes de valeurs foncières (DVF) over ten half-years, for sales of a single property. Individual sales are not shown. A median is only given where there were at least ten sales.
Source: DGFiP property sales (DVF), data.gouv.fr statistics (Open Licence 2.0)
Income and work.
Work and qualifications at the 2022 census.
Sources: Insee, 2022 population census (sub-municipal files, Open Licence 2.0)
Health, shops and services.
Facilities and services in Marne on 1 January 2025, from Insee’s permanent database of facilities.
Insee’s permanent database of facilities lists the shops, services and health professionals present in each commune on 1 January. Health professionals in private practice are counted one by one; several may work at the same address.
Source: Insee, permanent database of facilities 2025 (Open Licence 2.0)
Natural and industrial hazards.
Share of the département’s 613 communes exposed to each major hazard, and natural-disaster declarations since 1982.
Natural-disaster declarations by type
A natural-disaster declaration (arrêté CatNat) lets insurers pay out for the damage. The count reflects past events, not a forecast of future risk. The list of hazards comes from each département’s major-risk file; a prevention plan in force limits building in exposed zones.
Source: Géorisques, GASPAR database (Open Licence 2.0), as of 5 October 2026