Morbihan
Morbihan has 776,103 residents in 249 communes. Over five years, homes sold for a median €2,660/m², from €1,120/m² in Guiscriff to €5,700/m² in Carnac among communes of more than 2,000 people. 68% of households own their main home.
Four maps of Morbihan.
Each commune is coloured by its value; every map uses the same colour scale, from lowest to highest. Grey: not published.
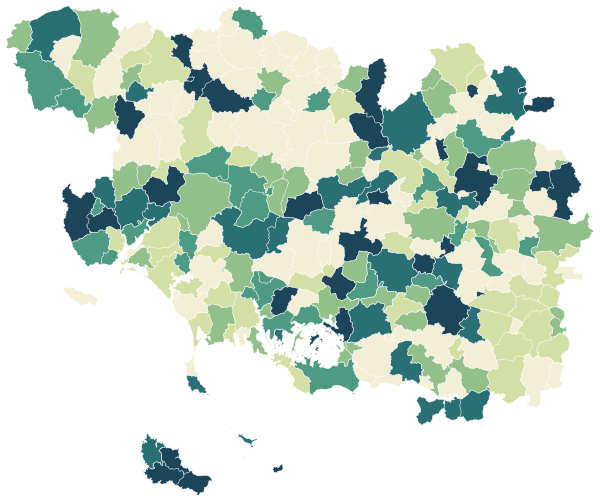
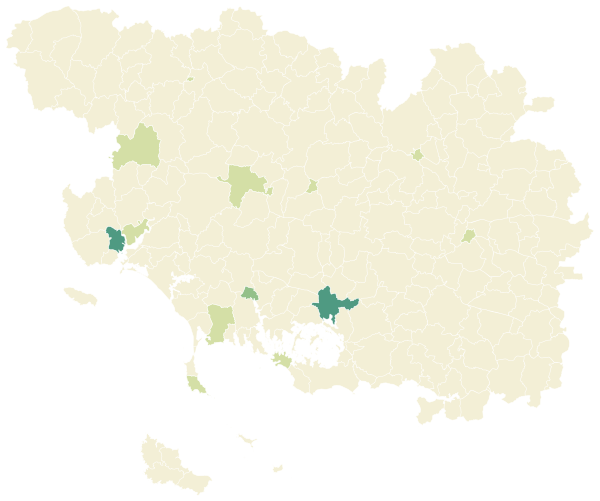
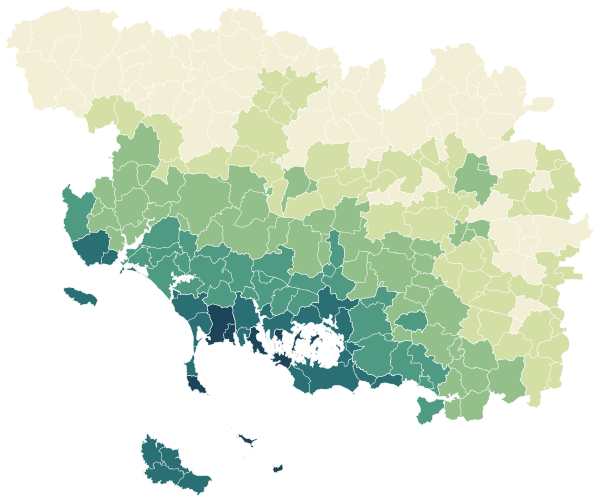
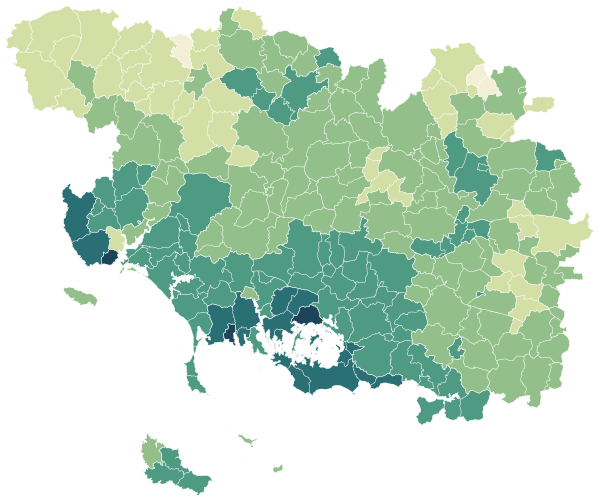
Sources: IGN and Insee, IRIS boundaries and Admin Express 2024 (Open Licence 2.0) · DGFiP property sales (DVF), data.gouv.fr statistics (Open Licence 2.0) · Insee, Filosofi 2021 income data (Open Licence 2.0) · © OpenStreetMap contributors (ODbL)
The 107 communes with more than 2,000 people.
Colour shows where each commune sits among the others in the table, from lowest to highest.
| Commune | Residents | Price per m² | Living standard | Home owners | Aged 75+ | Unemployment | Green 500 m | Services 15 min |
|---|---|---|---|---|---|---|---|---|
| Allaire | 3,906 | €1,780/m² | €22,230 | 74% | 12% | 10.3% | 9% | 54 |
| Ambon | 2,091 | €2,850/m² | €24,370 | 72% | 9% | 9.8% | 28% | 17 |
| Arradon | 5,820 | €4,730/m² | €30,120 | 72% | 18% | 7.3% | 19% | 29 |
| Arzon | 2,272 | €5,170/m² | €28,390 | 72% | 26% | 16.8% | 8% | 77 |
| Auray | 14,417 | €3,550/m² | €22,470 | 47% | 15% | 13.8% | 17% | 107 |
| Baden | 4,864 | €4,370/m² | €28,080 | 76% | 14% | 8.9% | 20% | 27 |
| Baud | 6,246 | €2,170/m² | €22,770 | 74% | 12% | 8.8% | 16% | 62 |
| Belz | 3,869 | €3,480/m² | €23,470 | 77% | 17% | 11.8% | 8% | 26 |
| Berric | 2,119 | €2,750/m² | €23,310 | 78% | 6% | 6.3% | 12% | 10 |
| Bignan | 2,750 | €1,930/m² | €22,750 | 77% | 8% | 7.2% | 23% | 15 |
| Brech | 7,057 | €3,080/m² | €24,230 | 78% | 9% | 6.2% | 13% | 19 |
| Bréhan | 2,298 | €1,420/m² | €22,500 | 80% | 13% | 8.6% | 100% | 15 |
| Bubry | 2,262 | €1,330/m² | €20,630 | 83% | 16% | 12.8% | 9% | 23 |
| Camors | 3,180 | €2,000/m² | €22,200 | 84% | 10% | 7.2% | 15% | 24 |
| Carentoir | 3,137 | €1,430/m² | €20,980 | 75% | 14% | 9.9% | 10% | 24 |
| Carnac | 4,215 | €5,700/m² | €26,230 | 73% | 22% | 10.7% | 14% | 61 |
| Caudan | 7,110 | €2,600/m² | €24,070 | 75% | 13% | 7.0% | 22% | 21 |
| Cléguer | 3,404 | €2,120/m² | €23,140 | 84% | 9% | 6.4% | 13% | 19 |
| Cléguérec | 2,849 | €1,390/m² | €22,080 | 83% | 13% | 10.6% | 0% | 34 |
| Colpo | 2,258 | €2,330/m² | €22,660 | 79% | 9% | 7.1% | 21% | 13 |
| Crach | 3,458 | €3,750/m² | €25,590 | 80% | 14% | 10.2% | 7% | 25 |
| Elven | 6,543 | €2,650/m² | €23,150 | 67% | 8% | 7.7% | 24% | 43 |
| Erdeven | 3,987 | €3,770/m² | €23,940 | 75% | 11% | 11.6% | 0% | 29 |
| Forges de Lanouée | 2,190 | €1,330/m² | €21,500 | 82% | 11% | 7.4% | 27% | 8 |
| Férel | 3,445 | €2,360/m² | €23,200 | 81% | 9% | 9.2% | 29% | 20 |
| Gestel | 2,569 | €2,660/m² | €25,010 | 78% | 6% | 7.5% | 18% | 24 |
| Gourin | 3,892 | €1,190/m² | €20,660 | 78% | 15% | 10.3% | 22% | 54 |
| Grand-Champ | 5,859 | €2,650/m² | €24,130 | 79% | 9% | 5.7% | 2% | 32 |
| Groix | 2,308 | €4,440/m² | €22,250 | 76% | 20% | 13.1% | 4% | 52 |
| Guer | 6,056 | €1,780/m² | €22,590 | 62% | 10% | 9.1% | 58% | 4 |
| Guidel | 12,236 | €3,450/m² | €26,610 | 71% | 10% | 9.0% | 36% | 23 |
| Guiscriff | 2,053 | €1,120/m² | €20,540 | 84% | 14% | 11.2% | 18% | 24 |
| Guégon | 2,308 | €1,520/m² | €21,960 | 82% | 12% | 8.2% | 6% | 6 |
| Hennebont | 15,831 | €2,440/m² | €22,060 | 58% | 12% | 12.0% | 25% | 51 |
| Inguiniel | 2,196 | €1,700/m² | €21,190 | 84% | 8% | 9.5% | 1% | 21 |
| Inzinzac-Lochrist | 6,631 | €2,280/m² | €22,680 | 79% | 9% | 8.1% | 49% | 19 |
| Josselin | 2,559 | €1,650/m² | €21,450 | 61% | 20% | 11.4% | 13% | 72 |
| Kervignac | 7,085 | €2,960/m² | €24,950 | 81% | 6% | 5.9% | 9% | 29 |
| La Gacilly | 4,011 | €1,600/m² | €22,100 | 74% | 13% | 7.9% | 9% | 56 |
| Landaul | 2,487 | €2,800/m² | €22,470 | 81% | 6% | 7.1% | 8% | 14 |
| Landévant | 4,049 | €2,670/m² | €22,870 | 79% | 8% | 6.2% | 2% | 11 |
| Lanester | 23,188 | €2,450/m² | €21,330 | 58% | 12% | 12.5% | 16% | 90 |
| Languidic | 8,046 | €2,150/m² | €23,100 | 77% | 9% | 6.9% | 14% | 13 |
| Larmor-Plage | 8,368 | €4,410/m² | €29,380 | 70% | 21% | 8.1% | 16% | 24 |
| Le Bono | 2,594 | €3,800/m² | €25,000 | 77% | 12% | 8.2% | 12% | 42 |
| Le Faouët | 2,816 | €1,450/m² | €21,240 | 75% | 21% | 11.5% | 9% | 50 |
| Le Palais | 2,576 | €4,320/m² | €23,800 | 64% | 13% | 14.4% | 31% | 55 |
| Le Sourn | 2,128 | €1,710/m² | €23,480 | 80% | 12% | 5.7% | 18% | 12 |
| Locminé | 4,708 | €2,060/m² | €21,630 | 53% | 10% | 9.5% | 2% | 81 |
| Locmiquélic | 4,094 | €2,940/m² | €23,560 | 77% | 15% | 8.7% | 3% | 48 |
| Locoal-Mendon | 3,529 | €3,190/m² | €23,900 | 78% | 7% | 7.3% | 0% | 24 |
| Lorient | 58,202 | €2,590/m² | €20,860 | 43% | 12% | 14.7% | 6% | 170 |
| Malansac | 2,292 | €1,870/m² | €22,160 | 79% | 13% | 9.0% | 6% | 26 |
| Malestroit | 2,533 | €2,040/m² | €23,020 | 64% | 22% | 8.2% | 6% | 75 |
| Marzan | 2,611 | €2,330/m² | €22,960 | 80% | 8% | 6.4% | 12% | 6 |
| Mauron | 3,169 | €1,340/m² | €21,020 | 78% | 17% | 11.7% | 24% | 48 |
| Merlevenez | 3,191 | €2,750/m² | €23,540 | 80% | 8% | 5.7% | 6% | 32 |
| Meucon | 2,278 | €2,840/m² | €24,900 | 76% | 13% | 5.3% | 8% | 21 |
| Monterblanc | 3,342 | €2,600/m² | €24,310 | 79% | 5% | 6.9% | 10% | 22 |
| Moréac | 3,692 | €1,650/m² | €22,100 | 80% | 7% | 6.2% | 4% | 30 |
| Muzillac | 5,022 | €2,760/m² | €23,700 | 69% | 18% | 10.4% | 14% | 50 |
| Nivillac | 4,874 | €2,220/m² | €22,900 | 78% | 12% | 8.9% | 8% | 17 |
| Noyal-Muzillac | 2,548 | €2,330/m² | €22,890 | 77% | 11% | 9.3% | 0% | 16 |
| Noyal-Pontivy | 3,605 | €1,510/m² | €23,320 | 82% | 11% | 6.1% | 2% | 25 |
| Plescop | 6,200 | €3,330/m² | €24,200 | 57% | 8% | 10.0% | 7% | 49 |
| Ploemel | 3,109 | €3,560/m² | €24,320 | 83% | 7% | 8.6% | 5% | 22 |
| Ploemeur | 18,873 | €3,650/m² | €26,690 | 74% | 16% | 9.6% | 21% | 43 |
| Ploeren | 6,781 | €3,380/m² | €26,080 | 66% | 8% | 9.3% | 4% | 35 |
| Plouay | 5,779 | €2,120/m² | €22,580 | 71% | 11% | 7.9% | 0% | 79 |
| Plougoumelen | 2,599 | €3,410/m² | €26,200 | 83% | 7% | 7.4% | 32% | 16 |
| Plouharnel | 2,272 | €4,020/m² | €24,810 | 78% | 11% | 11.1% | 9% | 30 |
| Plouhinec | 5,343 | €3,360/m² | €24,450 | 80% | 13% | 8.6% | 6% | 26 |
| Ploërmel | 10,021 | €2,060/m² | €23,340 | 63% | 13% | 8.5% | 37% | 37 |
| Plumelec | 2,730 | €1,800/m² | €21,540 | 76% | 9% | 9.2% | 0% | 29 |
| Plumelin | 2,841 | €2,010/m² | €22,570 | 81% | 13% | 6.2% | 11% | 12 |
| Plumergat | 4,199 | €2,810/m² | €23,830 | 79% | 7% | 8.4% | 0% | 8 |
| Pluméliau-Bieuzy | 4,535 | €1,600/m² | €22,010 | 83% | 11% | 6.9% | 1% | 33 |
| Pluneret | 6,257 | €3,100/m² | €23,930 | 70% | 7% | 7.2% | 17% | 38 |
| Pluvigner | 7,644 | €2,520/m² | €22,820 | 79% | 10% | 8.0% | 24% | 0 |
| Pont-Scorff | 4,015 | €2,440/m² | €23,570 | 76% | 9% | 8.5% | 29% | 36 |
| Pontivy | 14,547 | €1,720/m² | €21,630 | 52% | 12% | 13.8% | 11% | 25 |
| Port-Louis | 2,689 | €3,420/m² | €23,780 | 66% | 21% | 14.4% | 7% | 58 |
| Péaule | 2,856 | €2,070/m² | €22,270 | 75% | 10% | 6.8% | 0% | 17 |
| Pénestin | 2,057 | €3,500/m² | €24,630 | 79% | 24% | 9.3% | 25% | 46 |
| Questembert | 8,081 | €2,330/m² | €22,830 | 68% | 11% | 11.6% | 46% | 18 |
| Quiberon | 4,782 | €5,220/m² | €25,010 | 69% | 24% | 14.2% | 27% | 88 |
| Quéven | 8,906 | €2,610/m² | €24,240 | 77% | 12% | 7.9% | 31% | 15 |
| Riantec | 5,742 | €2,940/m² | €23,230 | 74% | 13% | 11.5% | 14% | 44 |
| Rieux | 2,841 | €1,680/m² | €21,940 | 78% | 10% | 10.2% | 5% | 36 |
| Saint-Avé | 12,173 | €3,230/m² | €24,360 | 61% | 10% | 9.7% | 40% | 31 |
| Saint-Dolay | 2,636 | €1,900/m² | €21,420 | 81% | 8% | 10.3% | 1% | 18 |
| Saint-Jean-Brévelay | 2,860 | €2,000/m² | €22,450 | 75% | 11% | 8.9% | 1% | 19 |
| Saint-Nolff | 3,952 | €2,700/m² | €25,200 | 81% | 10% | 7.8% | 18% | 17 |
| Saint-Pierre-Quiberon | 2,327 | €4,720/m² | €24,330 | 77% | 18% | 12.6% | 4% | 48 |
| Sainte-Anne-d'Auray | 2,837 | €3,170/m² | €23,730 | 69% | 16% | 8.0% | 18% | 47 |
| Sarzeau | 9,068 | €4,310/m² | €26,370 | 73% | 20% | 14.9% | 18% | 3 |
| Sulniac | 3,847 | €2,660/m² | €23,640 | 76% | 6% | 7.8% | 7% | 34 |
| Surzur | 5,110 | €3,220/m² | €24,930 | 78% | 8% | 7.0% | 0% | 33 |
| Séné | 9,265 | €3,790/m² | €25,460 | 63% | 14% | 9.3% | 55% | 10 |
| Sérent | 3,386 | €1,980/m² | €21,460 | 77% | 10% | 8.0% | 15% | 23 |
| Taupont | 2,400 | €1,700/m² | €23,620 | 81% | 9% | 8.1% | 12% | 19 |
| Theix-Noyalo | 8,476 | €3,240/m² | €24,910 | 70% | 10% | 8.8% | 27% | 21 |
| Treffléan | 2,531 | €2,700/m² | €23,380 | 81% | 6% | 5.2% | 12% | 15 |
| Val d'Oust | 2,808 | €1,670/m² | €22,600 | 78% | 10% | 10.1% | 25% | 16 |
| Vannes | 54,955 | €3,900/m² | €24,070 | 45% | 14% | 12.2% | 14% | 162 |
| Étel | 2,058 | €3,840/m² | €23,980 | 71% | 23% | 18.0% | 2% | 44 |
| Évellys | 3,384 | €1,450/m² | €21,970 | 83% | 8% | 7.7% | 0% | 10 |
Sources: Insee, 2022 population census (sub-municipal files, Open Licence 2.0) · DGFiP property sales (DVF), data.gouv.fr statistics (Open Licence 2.0) · Insee, Filosofi 2021 income data (Open Licence 2.0) · © OpenStreetMap contributors (ODbL)
People.
776,103 residents and 368,692 households at the 2022 census, next to the département figure.
Source: Insee, 2022 population census (sub-municipal files, Open Licence 2.0)
Homes.
486,769 homes, 76% of them main residences, with 4.4 rooms on average.
When main homes were built
Source: Insee, 2022 population census (sub-municipal files, Open Licence 2.0)
Property prices.
58,150 house and flat sales over five years.
Median prices from sales published in France’s Demandes de valeurs foncières (DVF) over ten half-years, for sales of a single property. Individual sales are not shown. A median is only given where there were at least ten sales.
Source: DGFiP property sales (DVF), data.gouv.fr statistics (Open Licence 2.0)
Income and work.
Work and qualifications at the 2022 census.
Sources: Insee, 2022 population census (sub-municipal files, Open Licence 2.0)
Health, shops and services.
Facilities and services in Morbihan on 1 January 2025, from Insee’s permanent database of facilities.
Insee’s permanent database of facilities lists the shops, services and health professionals present in each commune on 1 January. Health professionals in private practice are counted one by one; several may work at the same address.
Source: Insee, permanent database of facilities 2025 (Open Licence 2.0)
Natural and industrial hazards.
Share of the département’s 250 communes exposed to each major hazard, and natural-disaster declarations since 1982.
Natural-disaster declarations by type
A natural-disaster declaration (arrêté CatNat) lets insurers pay out for the damage. The count reflects past events, not a forecast of future risk. The list of hazards comes from each département’s major-risk file; a prevention plan in force limits building in exposed zones.
Source: Géorisques, GASPAR database (Open Licence 2.0), as of 5 October 2026
Communes.
166 communes in the département have their own page.