Moselle
Moselle has 1,050,721 residents in 725 communes. 60% of households own their main home.
Three maps of Moselle.
Each commune is coloured by its value; every map uses the same colour scale, from lowest to highest. Grey: not published.
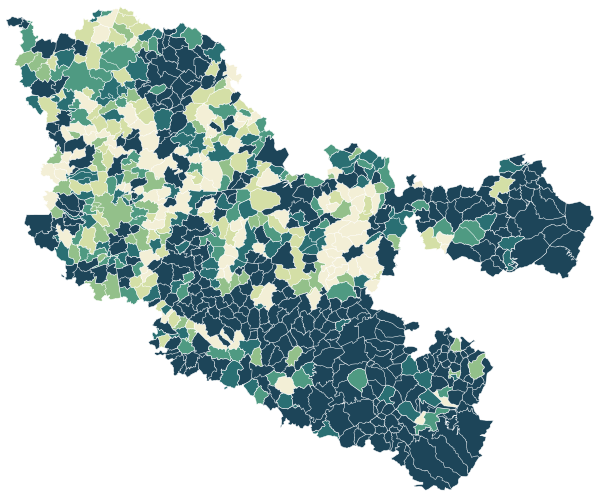
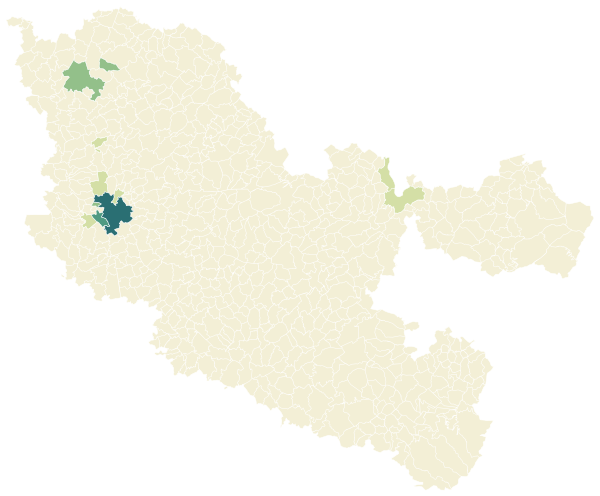
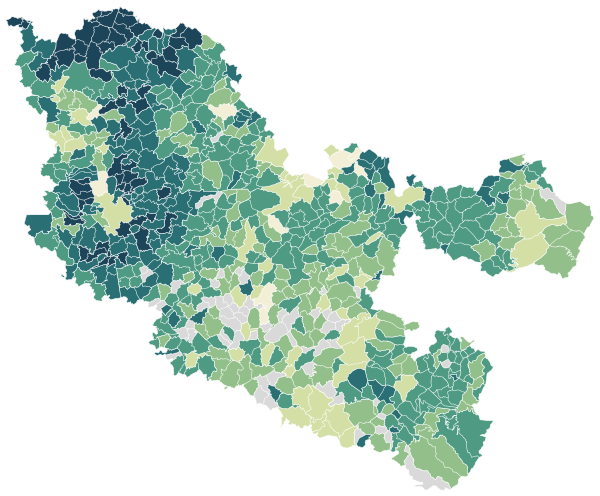
Sources: IGN and Insee, IRIS boundaries and Admin Express 2024 (Open Licence 2.0) · DGFiP property sales (DVF), data.gouv.fr statistics (Open Licence 2.0) · Insee, Filosofi 2021 income data (Open Licence 2.0) · © OpenStreetMap contributors (ODbL)
The 107 communes with more than 2,000 people.
Colour shows where each commune sits among the others in the table, from lowest to highest.
| Commune | Residents | Living standard | Home owners | Aged 75+ | Unemployment | Green 500 m | Services 15 min |
|---|---|---|---|---|---|---|---|
| Algrange | 5,928 | €20,970 | 55% | 11% | 12.5% | 39% | 18 |
| Alsting | 2,493 | €25,770 | 81% | 11% | 6.5% | 23% | 12 |
| Amanvillers | 2,154 | €25,870 | 76% | 6% | 8.6% | 13% | 16 |
| Amnéville | 10,853 | €22,440 | 55% | 9% | 12.0% | 4% | 25 |
| Ars-sur-Moselle | 4,645 | €21,290 | 51% | 9% | 16.1% | 74% | 21 |
| Audun-le-Tiche | 7,268 | €25,580 | 57% | 8% | 8.4% | 21% | 47 |
| Augny | 2,127 | €28,100 | 63% | 7% | 7.0% | 6% | 20 |
| Aumetz | 2,401 | €24,260 | 64% | 8% | 8.9% | 11% | 23 |
| Basse-Ham | 2,318 | €28,640 | 83% | 13% | 7.6% | 7% | 15 |
| Behren-lès-Forbach | 6,299 | €15,770 | 22% | 10% | 23.1% | 50% | 22 |
| Bertrange | 2,900 | €30,270 | 82% | 8% | 5.0% | 11% | 32 |
| Bitche | 4,899 | €19,680 | 54% | 10% | 13.7% | 63% | 19 |
| Boulange | 2,431 | €25,480 | 79% | 7% | 9.4% | 23% | 9 |
| Boulay-Moselle | 5,479 | €22,000 | 55% | 11% | 10.4% | 3% | 31 |
| Bousse | 3,254 | €28,700 | 85% | 9% | 5.9% | 5% | 16 |
| Bouzonville | 3,824 | €18,840 | 61% | 10% | 11.2% | 17% | 29 |
| Carling | 3,332 | €20,940 | 61% | 10% | 12.1% | 17% | 24 |
| Cattenom | 2,593 | €28,820 | 67% | 9% | 7.4% | 18% | 32 |
| Château-Salins | 2,294 | €21,410 | 54% | 13% | 14.5% | 17% | 43 |
| Clouange | 3,591 | €21,500 | 51% | 11% | 11.5% | 11% | 42 |
| Cocheren | 3,351 | €20,980 | 53% | 12% | 17.0% | 36% | 19 |
| Corny-sur-Moselle | 2,155 | €27,320 | 74% | 7% | 7.2% | 11% | 17 |
| Courcelles-Chaussy | 3,005 | €25,940 | 82% | 9% | 7.8% | 5% | 29 |
| Creutzwald | 12,389 | €19,470 | 50% | 11% | 18.1% | 58% | 16 |
| Créhange | 3,745 | €21,460 | 66% | 10% | 10.0% | 0% | 20 |
| Dabo | 2,367 | €23,020 | 84% | 14% | 8.5% | 46% | 12 |
| Dieuze | 2,792 | €20,590 | 49% | 17% | 13.2% | 11% | 45 |
| Ennery | 2,313 | €26,940 | 80% | 9% | 6.4% | 2% | 21 |
| Falck | 2,516 | €21,910 | 76% | 10% | 9.1% | 21% | 12 |
| Fameck | 14,759 | €19,950 | 61% | 10% | 15.7% | 15% | 32 |
| Farébersviller | 5,226 | €16,050 | 25% | 9% | 22.5% | 5% | 31 |
| Faulquemont | 5,154 | €20,970 | 55% | 11% | 14.9% | 26% | 5 |
| Florange | 11,891 | €21,130 | 59% | 9% | 12.1% | 4% | 44 |
| Folschviller | 3,937 | €18,660 | 52% | 10% | 17.5% | 6% | 40 |
| Fontoy | 3,163 | €24,190 | 70% | 12% | 9.3% | 36% | 15 |
| Forbach | 21,111 | €17,540 | 42% | 10% | 23.5% | 26% | 59 |
| Freyming-Merlebach | 13,069 | €18,530 | 39% | 11% | 19.2% | 19% | 38 |
| Gandrange | 3,006 | €24,210 | 75% | 11% | 10.2% | 3% | 22 |
| Grosbliederstroff | 3,322 | €25,510 | 66% | 10% | 6.5% | 22% | 72 |
| Guénange | 7,922 | €21,990 | 63% | 9% | 10.2% | 23% | 22 |
| Hagondange | 9,300 | €21,770 | 45% | 10% | 12.2% | 11% | 63 |
| Ham-sous-Varsberg | 2,889 | €22,820 | 72% | 9% | 11.3% | 8% | 11 |
| Hambach | 2,787 | €25,100 | 75% | 10% | 7.4% | 26% | 13 |
| Hayange | 16,013 | €21,480 | 60% | 9% | 14.4% | 30% | 18 |
| Hettange-Grande | 7,768 | €31,880 | 70% | 8% | 5.6% | 7% | 30 |
| Hombourg-Haut | 6,122 | €19,130 | 50% | 12% | 15.0% | 55% | 17 |
| Knutange | 3,206 | €19,320 | 52% | 8% | 15.8% | 22% | 36 |
| Kœnigsmacker | 2,242 | €27,530 | 74% | 7% | 5.7% | 28% | 21 |
| L'Hôpital | 5,179 | €20,080 | 62% | 9% | 19.2% | 11% | 25 |
| Le Ban-Saint-Martin | 4,637 | €23,500 | 43% | 7% | 9.4% | 11% | 130 |
| Longeville-lès-Metz | 4,017 | €25,800 | 48% | 11% | 11.3% | 12% | 50 |
| Longeville-lès-Saint-Avold | 3,592 | €23,860 | 67% | 11% | 8.5% | 7% | 28 |
| Macheren | 2,827 | €23,900 | 67% | 9% | 10.5% | 35% | 6 |
| Maizières-lès-Metz | 11,725 | €21,380 | 54% | 9% | 12.1% | 11% | 48 |
| Manom | 3,074 | €30,140 | 67% | 8% | 7.0% | 22% | 57 |
| Marange-Silvange | 6,517 | €24,080 | 72% | 9% | 11.0% | 38% | 7 |
| Marly | 9,937 | €27,920 | 70% | 14% | 8.3% | 13% | 50 |
| Metz | 121,695 | €20,940 | 34% | 8% | 14.8% | 14% | 235 |
| Metzervisse | 2,276 | €29,260 | 82% | 7% | 7.4% | 7% | 18 |
| Mondelange | 5,739 | €21,990 | 60% | 9% | 11.4% | 5% | 38 |
| Montigny-lès-Metz | 21,869 | €21,930 | 39% | 11% | 12.6% | 6% | 155 |
| Montois-la-Montagne | 2,717 | €23,450 | 75% | 8% | 7.6% | 14% | 22 |
| Morhange | 3,347 | €18,610 | 47% | 12% | 22.5% | 2% | 25 |
| Morsbach | 2,657 | €20,940 | 62% | 8% | 10.2% | 3% | 13 |
| Moulins-lès-Metz | 5,161 | €24,460 | 52% | 14% | 9.3% | 26% | 61 |
| Moyeuvre-Grande | 7,320 | €19,840 | 68% | 11% | 16.0% | 42% | 19 |
| Neufchef | 2,636 | €26,860 | 83% | 11% | 6.8% | 6% | 15 |
| Nilvange | 4,375 | €21,520 | 65% | 13% | 13.0% | 8% | 38 |
| Ottange | 3,012 | €27,400 | 76% | 10% | 9.2% | 40% | 17 |
| Petite-Rosselle | 6,176 | €19,950 | 64% | 9% | 15.4% | 20% | 25 |
| Phalsbourg | 4,657 | €22,420 | 57% | 9% | 12.5% | 11% | 54 |
| Plappeville | 2,025 | €31,940 | 82% | 10% | 8.9% | 21% | 20 |
| Porcelette | 2,435 | €25,030 | 86% | 10% | 7.4% | 1% | 26 |
| Puttelange-aux-Lacs | 3,058 | €21,050 | 71% | 11% | 17.0% | 1% | 14 |
| Richemont | 2,145 | €25,670 | 72% | 11% | 7.9% | 9% | 18 |
| Rohrbach-lès-Bitche | 2,290 | €24,620 | 71% | 11% | 8.8% | 16% | 30 |
| Rombas | 9,534 | €20,120 | 55% | 11% | 13.2% | 51% | 23 |
| Rosselange | 2,403 | €20,320 | 64% | 11% | 13.1% | 5% | 13 |
| Rurange-lès-Thionville | 2,349 | €30,550 | 90% | 5% | 4.6% | 8% | 5 |
| Réding | 2,307 | €23,820 | 79% | 11% | 7.9% | 27% | 23 |
| Rémilly | 2,050 | €25,000 | 68% | 12% | 5.1% | 32% | 26 |
| Saint-Avold | 14,828 | €20,940 | 47% | 11% | 15.3% | 38% | 45 |
| Saint-Julien-lès-Metz | 3,562 | €28,780 | 65% | 11% | 7.6% | 25% | 68 |
| Sainte-Marie-aux-Chênes | 4,512 | €23,720 | 72% | 9% | 7.4% | 3% | 31 |
| Sarralbe | 4,386 | €21,340 | 64% | 10% | 15.6% | 39% | 33 |
| Sarrebourg | 12,274 | €20,120 | 45% | 11% | 15.4% | 42% | 51 |
| Sarreguemines | 20,324 | €20,150 | 43% | 12% | 15.8% | 30% | 61 |
| Schœneck | 2,442 | €24,080 | 73% | 10% | 7.4% | 30% | 15 |
| Scy-Chazelles | 2,665 | €28,380 | 62% | 9% | 8.6% | 18% | 44 |
| Serémange-Erzange | 4,188 | €22,010 | 65% | 11% | 12.0% | 16% | 51 |
| Spicheren | 3,180 | €25,950 | 70% | 9% | 6.6% | 26% | 15 |
| Stiring-Wendel | 11,048 | €18,700 | 38% | 11% | 19.6% | 11% | 35 |
| Talange | 8,044 | €20,870 | 52% | 10% | 13.8% | 5% | 27 |
| Terville | 7,609 | €23,960 | 54% | 8% | 9.8% | 7% | 51 |
| Thionville | 42,778 | €24,850 | 45% | 10% | 10.7% | 16% | 123 |
| Théding | 2,424 | €20,320 | 54% | 8% | 19.6% | 1% | 7 |
| Tressange | 2,464 | €28,280 | 87% | 9% | 6.2% | 13% | 10 |
| Uckange | 7,001 | €18,760 | 56% | 9% | 14.6% | 9% | 31 |
| Valmont | 2,951 | €23,020 | 67% | 11% | 12.8% | 0% | 19 |
| Verny | 2,056 | €26,380 | 69% | 7% | 7.8% | 21% | 18 |
| Vitry-sur-Orne | 2,929 | €23,400 | 68% | 7% | 8.8% | 5% | 15 |
| Volmerange-les-Mines | 2,284 | €34,130 | 67% | 7% | 8.6% | 31% | 17 |
| Volstroff | 2,074 | €28,960 | 89% | 6% | 4.5% | 4% | 12 |
| Woippy | 14,394 | €17,410 | 37% | 7% | 20.1% | 7% | 80 |
| Woustviller | 2,822 | €23,050 | 71% | 9% | 11.8% | 31% | 14 |
| Yutz | 17,497 | €24,410 | 53% | 9% | 11.6% | 28% | 50 |
| Œting | 2,636 | €26,690 | 85% | 8% | 6.2% | 24% | 21 |
Sources: Insee, 2022 population census (sub-municipal files, Open Licence 2.0) · DGFiP property sales (DVF), data.gouv.fr statistics (Open Licence 2.0) · Insee, Filosofi 2021 income data (Open Licence 2.0) · © OpenStreetMap contributors (ODbL)
People.
1,050,721 residents and 474,077 households at the 2022 census, next to the département figure.
Source: Insee, 2022 population census (sub-municipal files, Open Licence 2.0)
Homes.
535,379 homes, 89% of them main residences, with 4.4 rooms on average.
When main homes were built
Source: Insee, 2022 population census (sub-municipal files, Open Licence 2.0)
Income and work.
Work and qualifications at the 2022 census.
Sources: Insee, 2022 population census (sub-municipal files, Open Licence 2.0)
Health, shops and services.
Facilities and services in Moselle on 1 January 2025, from Insee’s permanent database of facilities.
Insee’s permanent database of facilities lists the shops, services and health professionals present in each commune on 1 January. Health professionals in private practice are counted one by one; several may work at the same address.
Source: Insee, permanent database of facilities 2025 (Open Licence 2.0)
Natural and industrial hazards.
Share of the département’s 725 communes exposed to each major hazard, and natural-disaster declarations since 1982.
Natural-disaster declarations by type
A natural-disaster declaration (arrêté CatNat) lets insurers pay out for the damage. The count reflects past events, not a forecast of future risk. The list of hazards comes from each département’s major-risk file; a prevention plan in force limits building in exposed zones.
Source: Géorisques, GASPAR database (Open Licence 2.0), as of 5 October 2026