Pas-de-Calais
Pas-de-Calais has 1,460,184 residents in 890 communes. Over five years, homes sold for a median €1,760/m², from €860/m² in Frévent to €8,600/m² in Le Touquet-Paris-Plage among communes of more than 2,000 people. 58% of households own their main home.
Four maps of Pas-de-Calais.
Each commune is coloured by its value; every map uses the same colour scale, from lowest to highest. Grey: not published.
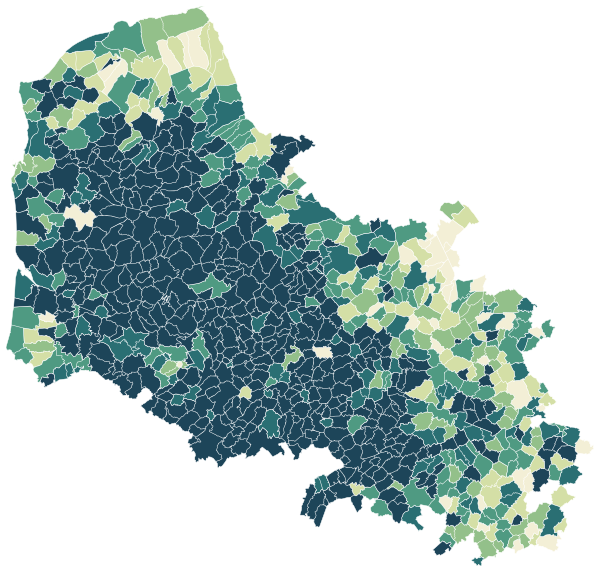
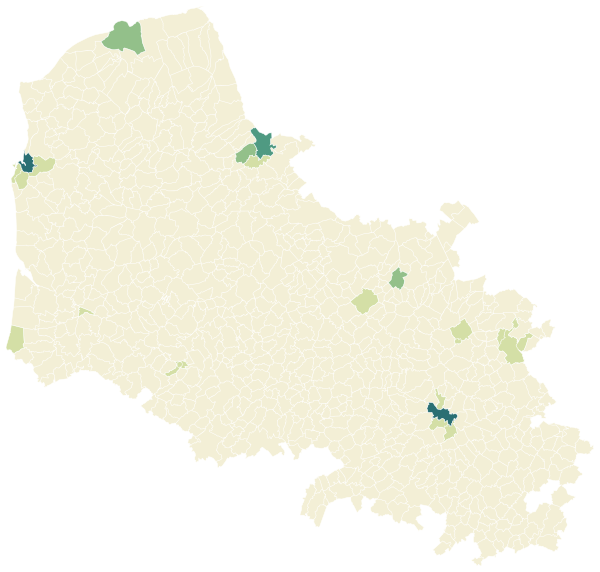
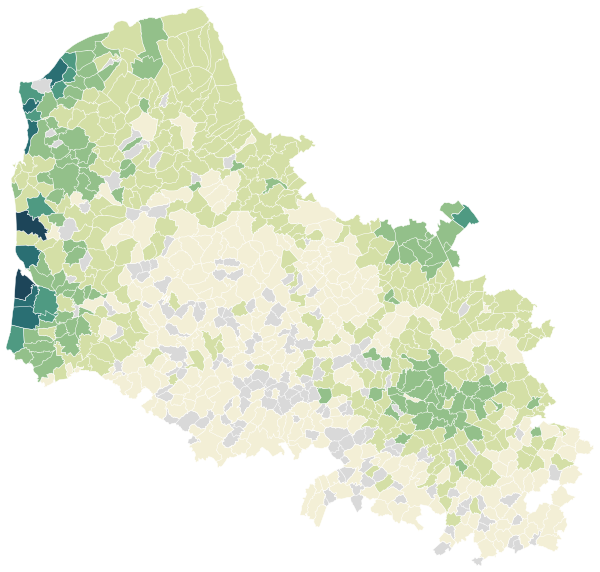
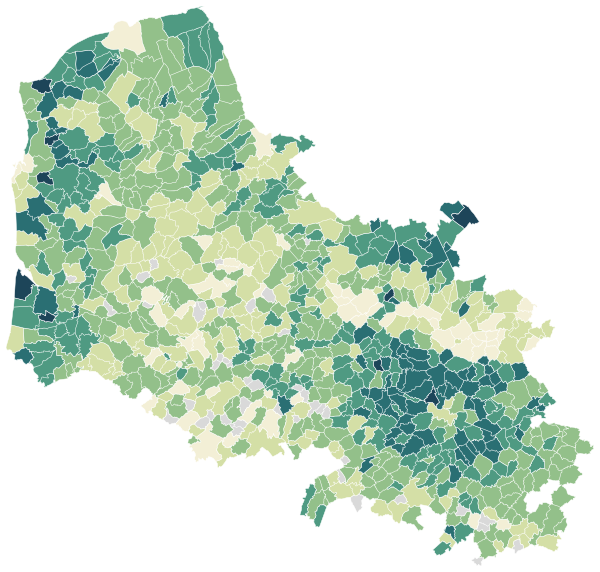
Sources: IGN and Insee, IRIS boundaries and Admin Express 2024 (Open Licence 2.0) · DGFiP property sales (DVF), data.gouv.fr statistics (Open Licence 2.0) · Insee, Filosofi 2021 income data (Open Licence 2.0) · © OpenStreetMap contributors (ODbL)
The 152 communes with more than 2,000 people.
Colour shows where each commune sits among the others in the table, from lowest to highest.
| Commune | Residents | Price per m² | Living standard | Home owners | Aged 75+ | Unemployment | Green 500 m | Services 15 min |
|---|---|---|---|---|---|---|---|---|
| Achicourt | 7,899 | €2,050/m² | €21,900 | 57% | 9% | 14.1% | 12% | 78 |
| Aire-sur-la-Lys | 9,568 | €1,460/m² | €20,730 | 61% | 10% | 15.5% | 23% | 7 |
| Aix-Noulette | 3,915 | €1,750/m² | €22,990 | 67% | 9% | 13.3% | 11% | 17 |
| Allouagne | 2,837 | €1,420/m² | €22,100 | 85% | 9% | 10.5% | 6% | 11 |
| Ambleteuse | 2,010 | €3,390/m² | €22,390 | 66% | 9% | 13.0% | 19% | 24 |
| Angres | 4,719 | €1,750/m² | €20,470 | 55% | 9% | 13.2% | 1% | 38 |
| Annay | 4,544 | €1,750/m² | €20,740 | 73% | 7% | 11.3% | 4% | 34 |
| Annequin | 2,147 | €1,640/m² | €20,090 | 51% | 6% | 12.8% | 9% | 24 |
| Annezin | 5,819 | €1,590/m² | €21,420 | 69% | 8% | 12.2% | 17% | 15 |
| Anzin-Saint-Aubin | 2,833 | €2,510/m² | €29,670 | 77% | 10% | 5.5% | 14% | 53 |
| Ardres | 4,393 | €1,880/m² | €21,360 | 60% | 9% | 14.1% | 6% | 48 |
| Arques | 9,526 | €1,680/m² | €19,590 | 58% | 10% | 13.8% | 69% | 33 |
| Arras | 42,621 | €2,230/m² | €20,230 | 34% | 8% | 17.5% | 19% | 213 |
| Auchel | 10,124 | €1,100/m² | €17,050 | 44% | 10% | 23.3% | 16% | 56 |
| Auchy-les-Mines | 4,642 | €1,860/m² | €20,220 | 60% | 7% | 15.0% | 2% | 41 |
| Audruicq | 5,349 | €1,870/m² | €21,500 | 60% | 9% | 11.8% | 5% | 40 |
| Auxi-le-Château | 2,549 | €940/m² | €18,150 | 56% | 13% | 24.8% | 34% | 30 |
| Avion | 17,571 | €1,460/m² | €17,830 | 41% | 7% | 19.1% | 18% | 48 |
| Bapaume | 3,718 | €1,220/m² | €18,760 | 42% | 11% | 19.1% | 7% | 57 |
| Barlin | 7,330 | €1,380/m² | €18,230 | 38% | 8% | 20.5% | 12% | 26 |
| Beaurains | 5,530 | €2,030/m² | €22,220 | 59% | 9% | 11.5% | 14% | 70 |
| Beaurainville | 2,028 | €1,590/m² | €20,380 | 66% | 11% | 13.0% | 29% | 18 |
| Berck | 12,967 | €2,950/m² | €20,780 | 46% | 15% | 16.5% | 20% | 80 |
| Beuvry | 9,078 | €1,590/m² | €20,670 | 62% | 10% | 16.1% | 25% | 30 |
| Biache-Saint-Vaast | 4,519 | €1,730/m² | €21,690 | 78% | 8% | 10.0% | 12% | 44 |
| Billy-Berclau | 5,076 | €1,940/m² | €23,260 | 74% | 7% | 7.9% | 1% | 27 |
| Billy-Montigny | 8,027 | €1,340/m² | €17,430 | 42% | 6% | 18.6% | 21% | 58 |
| Blendecques | 4,891 | €1,570/m² | €20,000 | 67% | 8% | 11.4% | 23% | 24 |
| Boulogne-sur-Mer | 41,039 | €1,610/m² | €17,720 | 29% | 9% | 22.1% | 12% | 234 |
| Bouvigny-Boyeffles | 2,385 | €1,840/m² | €25,290 | 80% | 11% | 8.1% | 21% | 12 |
| Brebières | 5,210 | €1,800/m² | €22,660 | 73% | 7% | 8.7% | 6% | 30 |
| Bruay-la-Buissière | 21,997 | €1,300/m² | €17,350 | 36% | 9% | 23.2% | 12% | 71 |
| Bully-les-Mines | 12,172 | €1,600/m² | €19,080 | 48% | 9% | 16.3% | 8% | 49 |
| Burbure | 2,827 | €1,250/m² | €20,450 | 74% | 9% | 9.9% | 16% | 16 |
| Béthune | 25,342 | €1,590/m² | €19,290 | 38% | 9% | 18.2% | 11% | 120 |
| Calais | 67,585 | €1,610/m² | €18,090 | 44% | 8% | 22.8% | 16% | 104 |
| Calonne-Ricouart | 5,416 | €1,320/m² | €17,610 | 40% | 9% | 18.9% | 28% | 34 |
| Camiers | 2,633 | €3,870/m² | €21,230 | 68% | 13% | 10.9% | 37% | 19 |
| Carvin | 17,966 | €1,770/m² | €20,130 | 56% | 8% | 14.6% | 12% | 49 |
| Cauchy-à-la-Tour | 2,645 | €1,130/m² | €19,580 | 68% | 9% | 14.6% | 19% | 14 |
| Chocques | 2,808 | €1,410/m² | €20,650 | 78% | 9% | 12.1% | 29% | 16 |
| Condette | 2,456 | €2,790/m² | €28,750 | 80% | 13% | 7.4% | 21% | 24 |
| Coquelles | 2,625 | €2,330/m² | €24,230 | 70% | 14% | 12.2% | 21% | 48 |
| Corbehem | 2,268 | €1,630/m² | €21,780 | 78% | 10% | 13.0% | 20% | 23 |
| Coulogne | 5,403 | €1,830/m² | €22,290 | 77% | 10% | 12.5% | 11% | 16 |
| Courcelles-lès-Lens | 8,015 | €1,750/m² | €18,890 | 62% | 6% | 15.3% | 18% | 30 |
| Courrières | 10,160 | €1,740/m² | €20,310 | 60% | 10% | 13.6% | 5% | 46 |
| Cucq | 5,165 | €4,280/m² | €23,240 | 65% | 16% | 11.5% | 40% | 21 |
| Dainville | 5,718 | €2,040/m² | €24,790 | 74% | 15% | 8.2% | 12% | 47 |
| Desvres | 4,827 | €1,470/m² | €18,210 | 55% | 11% | 18.8% | 62% | 24 |
| Divion | 6,830 | €1,330/m² | €17,560 | 44% | 8% | 18.7% | 10% | 15 |
| Dourges | 6,068 | €1,790/m² | €20,460 | 63% | 7% | 12.3% | 19% | 29 |
| Douvrin | 5,799 | €1,900/m² | €21,320 | 71% | 6% | 11.9% | 19% | 32 |
| Drocourt | 2,952 | €1,660/m² | €20,630 | 60% | 9% | 11.4% | 10% | 21 |
| Ecques | 2,176 | €1,980/m² | €23,460 | 87% | 8% | 6.7% | 23% | 7 |
| Estevelles | 2,002 | €1,850/m² | €22,850 | 74% | 6% | 8.5% | 17% | 14 |
| Fleurbaix | 2,944 | €2,850/m² | €30,270 | 79% | 9% | 5.4% | 8% | 23 |
| Fouquières-lès-Lens | 6,134 | €1,450/m² | €18,110 | 49% | 8% | 14.0% | 33% | 43 |
| Fruges | 2,349 | €990/m² | €17,990 | 48% | 12% | 15.6% | 16% | 38 |
| Frévent | 3,288 | €860/m² | €16,160 | 44% | 13% | 26.6% | 30% | 45 |
| Givenchy-en-Gohelle | 2,049 | €1,820/m² | €25,520 | 83% | 9% | 8.1% | 10% | 17 |
| Gonnehem | 2,532 | €1,900/m² | €24,540 | 86% | 9% | 7.8% | 36% | 14 |
| Grenay | 6,674 | €1,450/m² | €17,190 | 26% | 6% | 21.3% | 3% | 50 |
| Guînes | 5,508 | €1,560/m² | €19,160 | 62% | 8% | 14.8% | 17% | 14 |
| Haillicourt | 4,974 | €1,420/m² | €18,570 | 52% | 8% | 15.9% | 1% | 22 |
| Haisnes | 4,411 | €1,870/m² | €20,400 | 65% | 5% | 12.6% | 5% | 16 |
| Harnes | 12,264 | €1,500/m² | €18,510 | 48% | 9% | 16.1% | 25% | 30 |
| Hersin-Coupigny | 6,098 | €1,450/m² | €19,750 | 52% | 7% | 12.9% | 26% | 17 |
| Hesdin | 2,225 | €1,250/m² | €16,350 | 35% | 18% | 24.8% | 4% | 67 |
| Hinges | 2,450 | €2,090/m² | €25,890 | 86% | 7% | 7.7% | 14% | 9 |
| Houdain | 6,990 | €1,490/m² | €18,850 | 47% | 10% | 19.6% | 17% | 32 |
| Hulluch | 3,377 | €1,980/m² | €21,680 | 55% | 7% | 12.9% | 15% | 18 |
| Hénin-Beaumont | 25,764 | €1,430/m² | €19,170 | 49% | 8% | 17.8% | 18% | 69 |
| Isbergues | 8,653 | €1,270/m² | €20,020 | 70% | 12% | 13.0% | 16% | 18 |
| La Couture | 2,608 | €2,140/m² | €25,300 | 80% | 6% | 9.3% | 8% | 15 |
| Labourse | 2,876 | €1,820/m² | €22,080 | 70% | 6% | 9.8% | 16% | 45 |
| Lapugnoy | 3,500 | €1,450/m² | €21,470 | 69% | 10% | 10.4% | 21% | 23 |
| Laventie | 5,007 | €2,280/m² | €24,670 | 74% | 10% | 6.6% | 4% | 25 |
| Le Portel | 8,824 | €1,830/m² | €18,620 | 40% | 9% | 21.5% | 14% | 77 |
| Le Touquet-Paris-Plage | 4,223 | €8,600/m² | €31,410 | 63% | 24% | 13.0% | 26% | 50 |
| Leforest | 7,120 | €1,790/m² | €20,410 | 58% | 8% | 11.6% | 22% | 23 |
| Lens | 32,697 | €1,530/m² | €17,250 | 27% | 10% | 23.6% | 15% | 91 |
| Les Attaques | 2,065 | €2,070/m² | €22,260 | 82% | 8% | 10.2% | 10% | 18 |
| Lestrem | 5,041 | €2,140/m² | €24,210 | 74% | 7% | 6.8% | 17% | 20 |
| Libercourt | 8,047 | €1,660/m² | €18,470 | 44% | 8% | 17.7% | 28% | 37 |
| Lillers | 10,200 | €1,130/m² | €19,500 | 55% | 8% | 18.3% | 24% | 48 |
| Liévin | 30,113 | €1,470/m² | €17,840 | 40% | 8% | 20.4% | 13% | 53 |
| Locon | 2,332 | €2,030/m² | €26,330 | 82% | 8% | 7.7% | 2% | 16 |
| Loison-sous-Lens | 5,202 | €1,570/m² | €19,240 | 61% | 7% | 15.9% | 14% | 26 |
| Longuenesse | 10,559 | €1,750/m² | €19,380 | 53% | 10% | 20.1% | 15% | 85 |
| Loos-en-Gohelle | 6,850 | €1,640/m² | €20,350 | 60% | 9% | 13.7% | 7% | 25 |
| Lumbres | 3,577 | €1,420/m² | €19,780 | 57% | 9% | 11.5% | 21% | 37 |
| Marck | 10,468 | €2,000/m² | €22,600 | 73% | 7% | 13.7% | 11% | 16 |
| Marles-les-Mines | 5,437 | €1,200/m² | €16,840 | 32% | 9% | 23.0% | 14% | 43 |
| Marquise | 5,169 | €1,870/m² | €20,210 | 62% | 9% | 12.1% | 12% | 32 |
| Marœuil | 2,430 | €2,250/m² | €27,110 | 80% | 9% | 8.9% | 7% | 27 |
| Mazingarbe | 8,164 | €1,440/m² | €18,360 | 38% | 7% | 19.7% | 10% | 23 |
| Merlimont | 3,348 | €3,780/m² | €23,960 | 74% | 10% | 11.8% | 20% | 21 |
| Meurchin | 3,715 | €1,770/m² | €21,890 | 66% | 8% | 12.5% | 11% | 31 |
| Montigny-en-Gohelle | 9,667 | €1,490/m² | €18,640 | 49% | 10% | 21.9% | 12% | 67 |
| Méricourt | 11,651 | €1,560/m² | €18,630 | 46% | 9% | 19.0% | 14% | 35 |
| Neufchâtel-Hardelot | 3,993 | €5,000/m² | €25,500 | 69% | 13% | 9.4% | 30% | 15 |
| Noyelles-Godault | 5,949 | €1,730/m² | €19,040 | 45% | 7% | 15.9% | 24% | 60 |
| Noyelles-lès-Vermelles | 2,278 | €1,810/m² | €21,380 | 59% | 6% | 13.1% | 27% | 31 |
| Noyelles-sous-Lens | 6,757 | €1,450/m² | €17,590 | 33% | 10% | 17.7% | 9% | 45 |
| Nœux-les-Mines | 11,384 | €1,430/m² | €18,650 | 44% | 11% | 17.9% | 9% | 45 |
| Oignies | 10,260 | €1,760/m² | €18,760 | 43% | 8% | 15.7% | 20% | 40 |
| Outreau | 13,398 | €1,670/m² | €19,380 | 53% | 10% | 13.9% | 23% | 68 |
| Oye-Plage | 5,716 | €1,980/m² | €23,020 | 72% | 6% | 13.6% | 10% | 20 |
| Pont-à-Vendin | 3,099 | €1,480/m² | €19,540 | 61% | 5% | 15.6% | 29% | 37 |
| Racquinghem | 2,197 | €1,770/m² | €21,340 | 78% | 5% | 11.2% | 19% | 13 |
| Rang-du-Fliers | 4,339 | €2,270/m² | €22,870 | 76% | 11% | 9.8% | 6% | 19 |
| Rety | 2,050 | €1,740/m² | €20,130 | 72% | 6% | 11.4% | 26% | 1 |
| Richebourg | 2,653 | €2,120/m² | €26,110 | 80% | 9% | 5.5% | 2% | 21 |
| Rinxent | 3,007 | €1,810/m² | €20,320 | 69% | 9% | 10.1% | 7% | 19 |
| Rouvroy | 8,675 | €1,620/m² | €18,100 | 41% | 7% | 17.1% | 12% | 36 |
| Sailly-Labourse | 2,535 | €1,770/m² | €20,990 | 64% | 7% | 11.7% | 10% | 32 |
| Sailly-sur-la-Lys | 3,932 | €2,260/m² | €25,570 | 83% | 7% | 8.6% | 10% | 18 |
| Sains-en-Gohelle | 5,972 | €1,570/m² | €19,920 | 56% | 7% | 13.7% | 3% | 29 |
| Saint-Folquin | 2,339 | €1,990/m² | €24,620 | 77% | 7% | 7.2% | 9% | 8 |
| Saint-Laurent-Blangy | 6,492 | €2,090/m² | €21,570 | 50% | 9% | 12.3% | 32% | 43 |
| Saint-Léonard | 3,346 | €1,980/m² | €22,370 | 81% | 15% | 7.6% | 22% | 25 |
| Saint-Martin-Boulogne | 11,036 | €2,000/m² | €21,390 | 57% | 11% | 13.8% | 10% | 77 |
| Saint-Martin-lez-Tatinghem | 5,863 | €1,760/m² | €21,970 | 68% | 11% | 13.0% | 6% | 100 |
| Saint-Nicolas | 4,548 | €1,870/m² | €20,300 | 49% | 10% | 12.7% | 7% | 41 |
| Saint-Omer | 14,358 | €1,590/m² | €18,120 | 33% | 8% | 21.1% | 9% | 141 |
| Saint-Pol-sur-Ternoise | 4,759 | €1,090/m² | €18,810 | 40% | 13% | 20.3% | 13% | 18 |
| Saint-Venant | 3,002 | €1,600/m² | €22,800 | 71% | 12% | 8.3% | 18% | 26 |
| Saint-Étienne-au-Mont | 5,051 | €1,880/m² | €20,630 | 59% | 7% | 12.4% | 30% | 28 |
| Sainte-Catherine | 3,533 | €2,220/m² | €26,350 | 75% | 9% | 6.8% | 30% | 91 |
| Sallaumines | 9,633 | €1,460/m² | €16,370 | 27% | 8% | 24.2% | 22% | 49 |
| Samer | 4,642 | €1,930/m² | €20,220 | 63% | 7% | 10.3% | 3% | 36 |
| Sangatte | 4,755 | €2,420/m² | €23,630 | 64% | 8% | 11.9% | 25% | 11 |
| Souchez | 2,664 | €2,000/m² | €25,160 | 76% | 8% | 7.1% | 16% | 29 |
| Vendin-le-Vieil | 8,596 | €1,760/m² | €20,460 | 55% | 6% | 13.5% | 14% | 21 |
| Vendin-lès-Béthune | 2,384 | €1,580/m² | €21,800 | 78% | 12% | 10.2% | 18% | 24 |
| Vermelles | 4,729 | €1,550/m² | €19,730 | 59% | 7% | 11.4% | 8% | 32 |
| Verquigneul | 2,013 | €1,680/m² | €22,780 | 74% | 4% | 15.5% | 17% | 34 |
| Verquin | 3,452 | €1,580/m² | €21,110 | 61% | 8% | 14.1% | 19% | 17 |
| Verton | 2,557 | €2,450/m² | €24,280 | 79% | 6% | 11.1% | 13% | 9 |
| Vimy | 4,281 | €1,990/m² | €24,440 | 76% | 11% | 8.0% | 6% | 30 |
| Violaines | 3,844 | €1,990/m² | €23,050 | 70% | 6% | 9.3% | 1% | 29 |
| Vitry-en-Artois | 4,842 | €1,790/m² | €21,590 | 65% | 10% | 10.4% | 3% | 33 |
| Wimereux | 6,307 | €4,370/m² | €24,310 | 65% | 14% | 10.5% | 25% | 29 |
| Wimille | 3,839 | €2,370/m² | €21,560 | 66% | 9% | 12.3% | 27% | 31 |
| Wingles | 8,734 | €1,700/m² | €19,250 | 50% | 7% | 15.6% | 11% | 49 |
| Wizernes | 3,339 | €1,650/m² | €20,170 | 66% | 8% | 11.4% | 16% | 36 |
| Éleu-dit-Leauwette | 2,815 | €1,550/m² | €20,260 | 60% | 8% | 15.6% | 36% | 63 |
| Éperlecques | 3,740 | €1,770/m² | €21,580 | 72% | 6% | 9.6% | 25% | 14 |
| Équihen-Plage | 2,596 | €2,490/m² | €20,650 | 56% | 8% | 15.9% | 24% | 30 |
| Étaples | 10,693 | €2,440/m² | €19,120 | 54% | 9% | 16.2% | 26% | 42 |
| Évin-Malmaison | 4,657 | €1,820/m² | €19,350 | 58% | 7% | 16.0% | 2% | 12 |
Sources: Insee, 2022 population census (sub-municipal files, Open Licence 2.0) · DGFiP property sales (DVF), data.gouv.fr statistics (Open Licence 2.0) · Insee, Filosofi 2021 income data (Open Licence 2.0) · © OpenStreetMap contributors (ODbL)
People.
1,460,184 residents and 631,171 households at the 2022 census, next to the département figure.
Source: Insee, 2022 population census (sub-municipal files, Open Licence 2.0)
Homes.
732,092 homes, 86% of them main residences, with 4.5 rooms on average.
When main homes were built
Source: Insee, 2022 population census (sub-municipal files, Open Licence 2.0)
Property prices.
82,704 house and flat sales over five years.
Median prices from sales published in France’s Demandes de valeurs foncières (DVF) over ten half-years, for sales of a single property. Individual sales are not shown. A median is only given where there were at least ten sales.
Source: DGFiP property sales (DVF), data.gouv.fr statistics (Open Licence 2.0)
Income and work.
Work and qualifications at the 2022 census.
Sources: Insee, 2022 population census (sub-municipal files, Open Licence 2.0)
Health, shops and services.
Facilities and services in Pas-de-Calais on 1 January 2025, from Insee’s permanent database of facilities.
Insee’s permanent database of facilities lists the shops, services and health professionals present in each commune on 1 January. Health professionals in private practice are counted one by one; several may work at the same address.
Source: Insee, permanent database of facilities 2025 (Open Licence 2.0)
Natural and industrial hazards.
Share of the département’s 890 communes exposed to each major hazard, and natural-disaster declarations since 1982.
Natural-disaster declarations by type
A natural-disaster declaration (arrêté CatNat) lets insurers pay out for the damage. The count reflects past events, not a forecast of future risk. The list of hazards comes from each département’s major-risk file; a prevention plan in force limits building in exposed zones.
Source: Géorisques, GASPAR database (Open Licence 2.0), as of 5 October 2026