Rhône
Rhône has 1,907,982 residents in 266 communes. Over five years, homes sold for a median €3,910/m², from €1,270/m² in Cours to €5,850/m² in Saint-Cyr-au-Mont-d'Or among communes of more than 2,000 people. 49% of households own their main home.
Four maps of Rhône.
Each commune is coloured by its value; every map uses the same colour scale, from lowest to highest. Grey: not published.
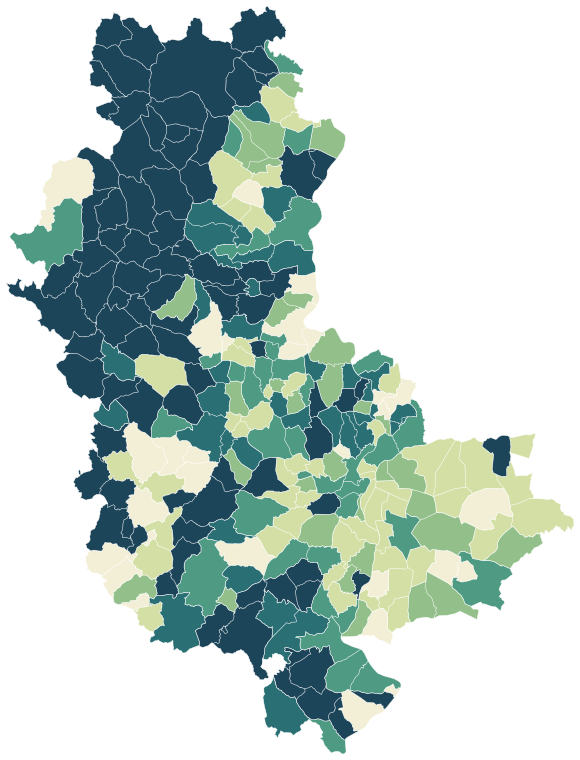
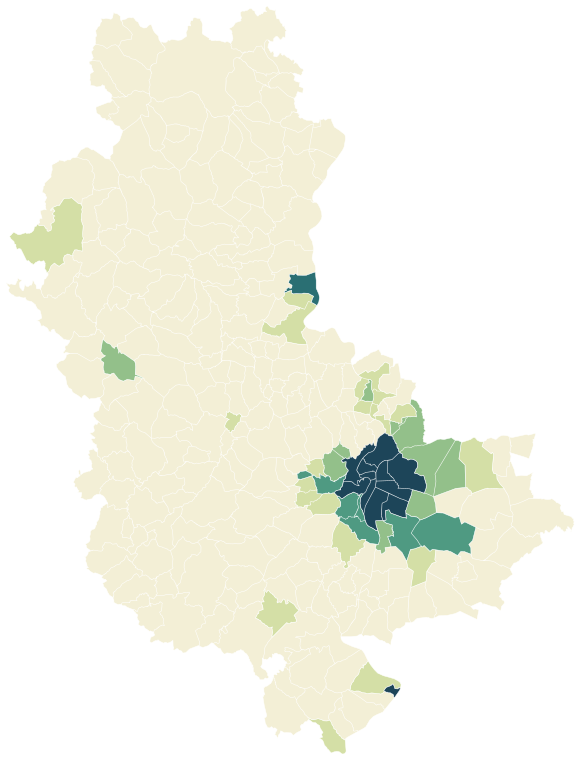
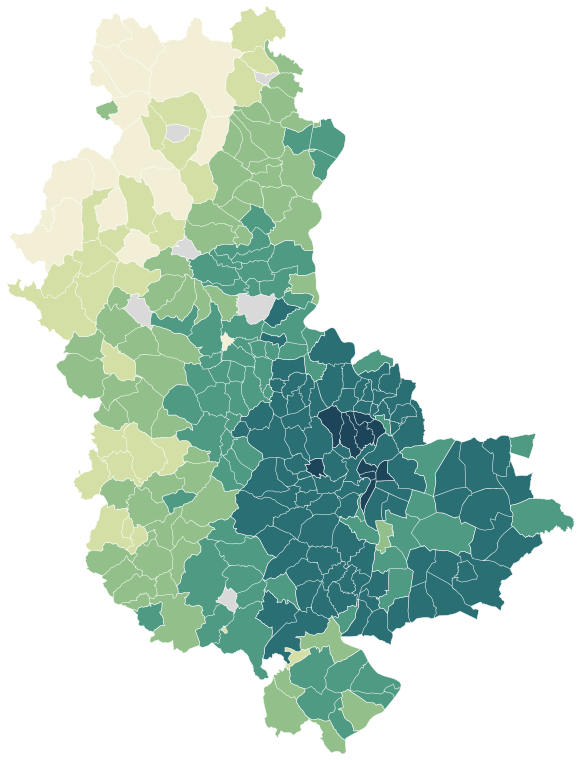
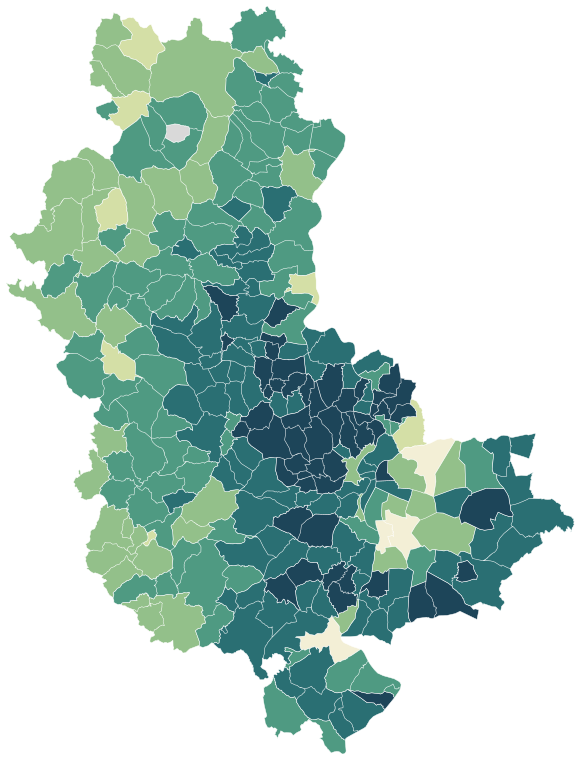
Sources: IGN and Insee, IRIS boundaries and Admin Express 2024 (Open Licence 2.0) · DGFiP property sales (DVF), data.gouv.fr statistics (Open Licence 2.0) · Insee, Filosofi 2021 income data (Open Licence 2.0) · © OpenStreetMap contributors (ODbL)
The 124 communes with more than 2,000 people.
Colour shows where each commune sits among the others in the table, from lowest to highest.
| Commune | Residents | Price per m² | Living standard | Home owners | Aged 75+ | Unemployment | Green 500 m | Services 15 min |
|---|---|---|---|---|---|---|---|---|
| Albigny-sur-Saône | 3,013 | €3,980/m² | €27,080 | 57% | 17% | 10.0% | 28% | 135 |
| Amplepuis | 4,858 | €1,540/m² | €21,120 | 56% | 14% | 11.7% | 30% | 31 |
| Ampuis | 2,760 | €2,660/m² | €26,440 | 64% | 11% | 5.0% | 4% | 22 |
| Anse | 8,139 | €3,400/m² | €24,690 | 58% | 8% | 8.2% | 5% | 70 |
| Arnas | 4,408 | €3,080/m² | €24,910 | 68% | 9% | 7.3% | 23% | 24 |
| Beaujeu | 2,103 | €1,420/m² | €21,680 | 56% | 16% | 6.9% | 53% | 20 |
| Beauvallon | 4,198 | €3,610/m² | €27,940 | 81% | 7% | 3.7% | 26% | 17 |
| Belleville-en-Beaujolais | 13,767 | €2,670/m² | €22,210 | 53% | 9% | 9.9% | 41% | 15 |
| Bessenay | 2,351 | €2,340/m² | €24,500 | 70% | 11% | 6.6% | 3% | 30 |
| Brignais | 12,330 | €4,140/m² | €26,720 | 61% | 12% | 7.8% | 16% | 55 |
| Brindas | 6,718 | €4,320/m² | €29,700 | 76% | 8% | 5.5% | 5% | 38 |
| Bron | 42,850 | €3,200/m² | €21,950 | 47% | 10% | 12.5% | 10% | 139 |
| Bully | 2,144 | €3,250/m² | €27,450 | 77% | 11% | 5.2% | 25% | 15 |
| Cailloux-sur-Fontaines | 2,951 | €4,690/m² | €34,010 | 84% | 5% | 5.7% | 3% | 21 |
| Caluire-et-Cuire | 43,479 | €4,170/m² | €27,370 | 55% | 12% | 9.0% | 20% | 243 |
| Chabanière | 4,274 | €2,970/m² | €25,960 | 76% | 7% | 5.5% | 50% | 24 |
| Champagne-au-Mont-d'Or | 6,124 | €4,230/m² | €27,100 | 53% | 12% | 8.9% | 4% | 104 |
| Chaponnay | 4,519 | €4,030/m² | €31,360 | 80% | 9% | 4.5% | 12% | 39 |
| Chaponost | 9,217 | €4,430/m² | €31,090 | 71% | 11% | 6.8% | 14% | 58 |
| Charbonnières-les-Bains | 5,272 | €5,080/m² | €36,390 | 71% | 13% | 8.7% | 7% | 64 |
| Charly | 4,670 | €4,660/m² | €33,860 | 80% | 11% | 7.3% | 11% | 31 |
| Chasselay | 2,901 | €4,100/m² | €32,350 | 76% | 15% | 5.2% | 13% | 26 |
| Chassieu | 11,214 | €4,450/m² | €28,750 | 66% | 9% | 9.1% | 7% | 43 |
| Chazay-d'Azergues | 4,270 | €3,890/m² | €31,020 | 74% | 9% | 7.0% | 7% | 45 |
| Chessy | 2,058 | €3,370/m² | €27,050 | 76% | 7% | 5.1% | 20% | 21 |
| Châtillon | 2,184 | €3,460/m² | €28,030 | 79% | 10% | 5.5% | 19% | 22 |
| Collonges-au-Mont-d'Or | 4,604 | €5,020/m² | €35,240 | 74% | 8% | 7.1% | 8% | 35 |
| Colombier-Saugnieu | 2,859 | €3,510/m² | €27,000 | 77% | 5% | 6.3% | 6% | 15 |
| Communay | 4,524 | €3,870/m² | €28,770 | 72% | 10% | 5.6% | 1% | 24 |
| Condrieu | 3,945 | €2,550/m² | €23,490 | 53% | 15% | 8.9% | 19% | 83 |
| Corbas | 11,196 | €3,640/m² | €25,250 | 73% | 8% | 10.1% | 10% | 69 |
| Cours | 4,329 | €1,270/m² | €21,050 | 62% | 17% | 11.1% | 4% | 29 |
| Couzon-au-Mont-d'Or | 2,541 | €3,820/m² | €28,290 | 67% | 12% | 7.8% | 13% | 71 |
| Craponne | 12,170 | €4,380/m² | €27,380 | 60% | 13% | 7.0% | 8% | 91 |
| Dardilly | 8,980 | €4,810/m² | €32,510 | 66% | 7% | 8.1% | 35% | 54 |
| Dommartin | 2,607 | €4,580/m² | €34,020 | 85% | 11% | 6.2% | 24% | 23 |
| Décines-Charpieu | 29,905 | €3,610/m² | €22,050 | 53% | 9% | 12.9% | 7% | 101 |
| Feyzin | 9,727 | €3,230/m² | €22,210 | 56% | 10% | 13.5% | 9% | 29 |
| Fleurieux-sur-l'Arbresle | 2,299 | €3,730/m² | €29,780 | 83% | 7% | 6.3% | 7% | 15 |
| Fontaines-Saint-Martin | 3,070 | €4,090/m² | €34,190 | 78% | 10% | 8.6% | 2% | 49 |
| Fontaines-sur-Saône | 7,005 | €3,480/m² | €25,230 | 55% | 10% | 10.2% | 13% | 83 |
| Francheville | 15,664 | €4,300/m² | €28,120 | 59% | 9% | 10.0% | 32% | 87 |
| Genas | 13,446 | €4,640/m² | €30,610 | 74% | 10% | 6.0% | 5% | 47 |
| Genay | 5,632 | €3,590/m² | €26,920 | 64% | 7% | 8.8% | 19% | 54 |
| Givors | 20,943 | €2,380/m² | €18,160 | 42% | 9% | 18.1% | 20% | 56 |
| Gleizé | 7,824 | €2,970/m² | €23,660 | 56% | 12% | 10.6% | 31% | 56 |
| Grigny | 9,941 | €2,700/m² | €21,900 | 58% | 8% | 8.8% | 16% | 55 |
| Grézieu-la-Varenne | 6,284 | €4,140/m² | €27,230 | 65% | 11% | 6.2% | 8% | 24 |
| Irigny | 8,909 | €4,060/m² | €25,740 | 66% | 9% | 9.1% | 12% | 32 |
| Jonage | 6,109 | €4,130/m² | €28,030 | 85% | 8% | 6.6% | 30% | 25 |
| L'Arbresle | 6,469 | €3,000/m² | €23,450 | 52% | 9% | 9.2% | 6% | 74 |
| La Mulatière | 6,554 | €3,040/m² | €22,750 | 54% | 11% | 12.7% | 13% | 169 |
| La Tour-de-Salvagny | 4,460 | €4,710/m² | €33,530 | 70% | 13% | 5.4% | 16% | 31 |
| Lentilly | 6,541 | €4,310/m² | €29,630 | 68% | 8% | 7.5% | 19% | 54 |
| Limas | 4,749 | €3,020/m² | €24,720 | 69% | 11% | 9.9% | 12% | 72 |
| Limonest | 3,933 | €5,340/m² | €34,510 | 61% | 9% | 7.0% | 29% | 45 |
| Lissieu | 3,193 | €4,040/m² | €33,180 | 82% | 8% | 6.7% | 34% | 27 |
| Loire-sur-Rhône | 2,736 | €2,860/m² | €24,520 | 70% | 9% | 7.9% | 15% | 14 |
| Lozanne | 3,182 | €4,060/m² | €26,930 | 58% | 9% | 6.2% | 24% | 34 |
| Lucenay | 2,068 | €3,480/m² | €28,690 | 84% | 7% | 6.2% | 4% | 13 |
| Lyon | 520,774 | €4,790/m² | €25,430 | 34% | 8% | 11.1% | 10% | 726 |
| Marcy-l'Étoile | 3,711 | €4,710/m² | €29,680 | 62% | 8% | 8.2% | 6% | 38 |
| Messimy | 3,565 | €3,610/m² | €27,280 | 72% | 7% | 5.0% | 5% | 25 |
| Meyzieu | 36,437 | €3,780/m² | €23,860 | 62% | 9% | 11.0% | 7% | 82 |
| Millery | 4,323 | €4,180/m² | €30,670 | 73% | 9% | 5.4% | 8% | 46 |
| Mions | 13,716 | €3,950/m² | €26,070 | 70% | 9% | 9.8% | 3% | 54 |
| Montagny | 3,212 | €4,060/m² | €27,760 | 83% | 9% | 7.1% | 22% | 21 |
| Montanay | 3,270 | €4,270/m² | €33,600 | 79% | 6% | 5.8% | 8% | 25 |
| Morancé | 2,267 | €3,720/m² | €29,600 | 81% | 9% | 4.9% | 18% | 9 |
| Mornant | 6,261 | €3,840/m² | €27,260 | 65% | 11% | 6.3% | 27% | 63 |
| Neuville-sur-Saône | 7,807 | €3,850/m² | €23,150 | 43% | 14% | 10.1% | 23% | 84 |
| Orliénas | 2,633 | €3,850/m² | €30,280 | 74% | 8% | 4.3% | 50% | 21 |
| Oullins-Pierre-Bénite | 37,928 | €3,460/m² | €24,040 | 49% | 9% | 11.5% | 7% | 174 |
| Pollionnay | 2,966 | €3,940/m² | €28,690 | 76% | 12% | 4.9% | 31% | 21 |
| Pommiers | 2,629 | €3,830/m² | €30,730 | 81% | 9% | 4.8% | 14% | 25 |
| Porte des Pierres Dorées | 4,079 | – | €27,510 | 82% | 8% | 4.8% | 33% | 19 |
| Pusignan | 4,145 | €3,870/m² | €27,420 | 80% | 7% | 6.6% | 10% | 28 |
| Quincieux | 3,620 | €3,660/m² | €26,670 | 74% | 8% | 5.8% | 11% | 25 |
| Rillieux-la-Pape | 31,479 | €3,620/m² | €19,980 | 41% | 9% | 15.6% | 16% | 122 |
| Sain-Bel | 2,568 | €2,900/m² | €24,670 | 56% | 7% | 7.8% | 24% | 27 |
| Saint-Bonnet-de-Mure | 6,988 | €4,100/m² | €28,700 | 79% | 10% | 7.9% | 7% | 0 |
| Saint-Cyr-au-Mont-d'Or | 6,113 | €5,850/m² | €40,340 | 70% | 13% | 8.1% | 26% | 48 |
| Saint-Didier-au-Mont-d'Or | 7,405 | €5,830/m² | €42,270 | 80% | 14% | 6.8% | 29% | 47 |
| Saint-Fons | 19,549 | €2,580/m² | €16,880 | 36% | 7% | 19.8% | 6% | 114 |
| Saint-Genis-Laval | 21,329 | €3,990/m² | €26,810 | 57% | 11% | 9.8% | 9% | 63 |
| Saint-Genis-les-Ollières | 5,370 | €4,470/m² | €30,290 | 75% | 8% | 6.0% | 13% | 91 |
| Saint-Georges-de-Reneins | 4,533 | €2,550/m² | €25,200 | 67% | 8% | 8.3% | 17% | 27 |
| Saint-Germain-Nuelles | 2,252 | €3,520/m² | €28,890 | 83% | 10% | 5.1% | 13% | 19 |
| Saint-Germain-au-Mont-d'Or | 3,037 | €3,800/m² | €27,110 | 56% | 7% | 9.6% | 29% | 30 |
| Saint-Laurent-d'Agny | 2,120 | €3,560/m² | €29,190 | 80% | 7% | 5.9% | 37% | 23 |
| Saint-Laurent-de-Mure | 5,651 | €4,060/m² | €27,380 | 76% | 8% | 6.3% | 14% | 50 |
| Saint-Martin-en-Haut | 3,917 | €3,120/m² | €24,790 | 64% | 14% | 4.4% | 20% | 41 |
| Saint-Pierre-de-Chandieu | 4,588 | €4,140/m² | €28,430 | 79% | 9% | 6.0% | 16% | 30 |
| Saint-Pierre-la-Palud | 2,586 | €3,010/m² | €26,870 | 69% | 7% | 7.6% | 13% | 21 |
| Saint-Priest | 49,193 | €3,300/m² | €21,420 | 50% | 8% | 12.3% | 11% | 168 |
| Saint-Symphorien-d'Ozon | 6,076 | €3,400/m² | €26,560 | 63% | 9% | 6.7% | 8% | 15 |
| Saint-Symphorien-sur-Coise | 3,749 | €2,300/m² | €21,800 | 56% | 16% | 7.4% | 3% | 55 |
| Saint-Étienne-des-Oullières | 2,236 | €2,740/m² | €25,040 | 71% | 8% | 6.4% | 10% | 25 |
| Sainte-Consorce | 2,109 | €4,180/m² | €30,200 | 80% | 9% | 4.2% | 7% | 10 |
| Sainte-Foy-lès-Lyon | 21,893 | €3,900/m² | €28,780 | 63% | 14% | 9.4% | 16% | 159 |
| Sathonay-Camp | 7,039 | €4,000/m² | €24,460 | 40% | 7% | 7.8% | 26% | 105 |
| Sathonay-Village | 2,418 | €4,500/m² | €33,220 | 84% | 10% | 5.4% | 28% | 78 |
| Solaize | 3,131 | €3,890/m² | €29,430 | 76% | 8% | 4.8% | 1% | 33 |
| Soucieu-en-Jarrest | 4,652 | €3,800/m² | €27,650 | 74% | 7% | 5.0% | 21% | 31 |
| Sourcieux-les-Mines | 2,098 | €3,380/m² | €28,150 | 82% | 8% | 6.0% | 25% | 20 |
| Sérézin-du-Rhône | 3,057 | €3,690/m² | €26,360 | 67% | 10% | 5.3% | 6% | 21 |
| Taluyers | 2,657 | €3,860/m² | €28,720 | 77% | 11% | 4.5% | 35% | 23 |
| Tarare | 10,881 | €1,930/m² | €19,730 | 36% | 12% | 14.9% | 25% | 101 |
| Tassin-la-Demi-Lune | 22,819 | €4,450/m² | €29,010 | 52% | 10% | 10.3% | 16% | 151 |
| Ternay | 5,582 | €3,710/m² | €27,400 | 75% | 9% | 8.4% | 11% | 43 |
| Thizy-les-Bourgs | 5,794 | €1,370/m² | €21,160 | 64% | 13% | 11.0% | 21% | 63 |
| Thurins | 3,268 | €3,480/m² | €26,100 | 65% | 7% | 4.7% | 2% | 31 |
| Toussieu | 3,186 | €4,050/m² | €29,590 | 83% | 7% | 4.2% | 3% | 19 |
| Val d'Oingt | 4,143 | €3,120/m² | €26,650 | 71% | 10% | 6.2% | 3% | 26 |
| Vaugneray | 6,198 | €3,820/m² | €26,950 | 68% | 11% | 4.6% | 16% | 33 |
| Vaulx-en-Velin | 52,448 | €3,020/m² | €17,180 | 38% | 5% | 19.8% | 6% | 126 |
| Vernaison | 5,175 | €3,820/m² | €27,760 | 60% | 10% | 8.4% | 36% | 42 |
| Villefranche-sur-Saône | 36,224 | €2,620/m² | €19,640 | 36% | 10% | 15.2% | 3% | 212 |
| Villeurbanne | 162,207 | €3,830/m² | €21,540 | 35% | 7% | 13.3% | 11% | 478 |
| Villié-Morgon | 2,132 | €2,440/m² | €24,700 | 73% | 9% | 4.9% | 13% | 24 |
| Vindry-sur-Turdine | 5,283 | €2,690/m² | €25,190 | 73% | 9% | 6.0% | 5% | 18 |
| Vourles | 3,353 | €4,660/m² | €32,340 | 75% | 11% | 6.0% | 6% | 20 |
| Vénissieux | 66,701 | €2,960/m² | €17,140 | 32% | 7% | 19.7% | 17% | 157 |
| Écully | 18,019 | €4,510/m² | €29,600 | 52% | 14% | 10.0% | 14% | 130 |
Sources: Insee, 2022 population census (sub-municipal files, Open Licence 2.0) · DGFiP property sales (DVF), data.gouv.fr statistics (Open Licence 2.0) · Insee, Filosofi 2021 income data (Open Licence 2.0) · © OpenStreetMap contributors (ODbL)
People.
1,907,982 residents and 868,755 households at the 2022 census, next to the département figure.
Source: Insee, 2022 population census (sub-municipal files, Open Licence 2.0)
Homes.
977,442 homes, 89% of them main residences, with 3.6 rooms on average.
When main homes were built
Source: Insee, 2022 population census (sub-municipal files, Open Licence 2.0)
Property prices.
118,534 house and flat sales over five years.
Median prices from sales published in France’s Demandes de valeurs foncières (DVF) over ten half-years, for sales of a single property. Individual sales are not shown. A median is only given where there were at least ten sales.
Source: DGFiP property sales (DVF), data.gouv.fr statistics (Open Licence 2.0)
Income and work.
Work and qualifications at the 2022 census.
Sources: Insee, 2022 population census (sub-municipal files, Open Licence 2.0)
Health, shops and services.
Facilities and services in Rhône on 1 January 2025, from Insee’s permanent database of facilities.
Insee’s permanent database of facilities lists the shops, services and health professionals present in each commune on 1 January. Health professionals in private practice are counted one by one; several may work at the same address.
Source: Insee, permanent database of facilities 2025 (Open Licence 2.0)
Natural and industrial hazards.
Share of the département’s 267 communes exposed to each major hazard, and natural-disaster declarations since 1982.
Natural-disaster declarations by type
A natural-disaster declaration (arrêté CatNat) lets insurers pay out for the damage. The count reflects past events, not a forecast of future risk. The list of hazards comes from each département’s major-risk file; a prevention plan in force limits building in exposed zones.
Source: Géorisques, GASPAR database (Open Licence 2.0), as of 5 October 2026
Every commune.
Every commune has its own page.