Seine-et-Marne
Seine-et-Marne has 1,452,399 residents in 507 communes. Over five years, homes sold for a median €3,210/m², from €1,780/m² in Bray-sur-Seine to €4,890/m² in Serris among communes of more than 2,000 people. 62% of households own their main home.
Four maps of Seine-et-Marne.
Each commune is coloured by its value; every map uses the same colour scale, from lowest to highest. Grey: not published.
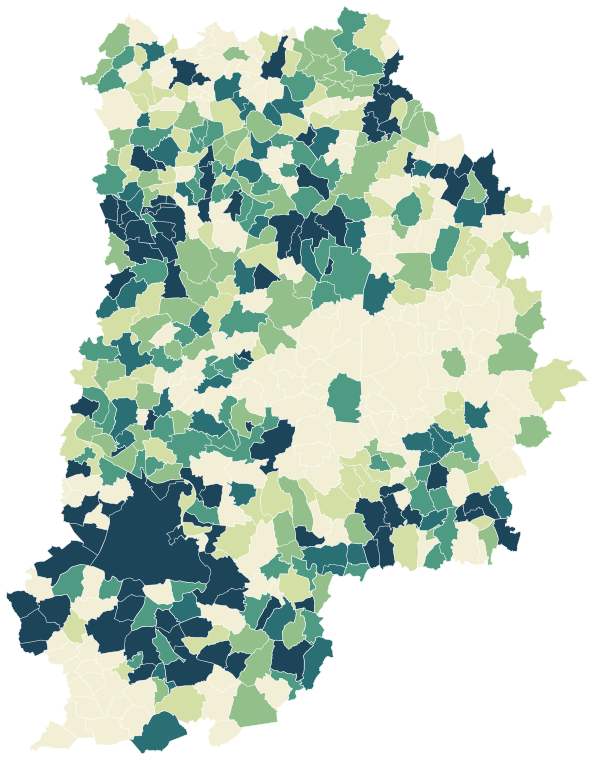
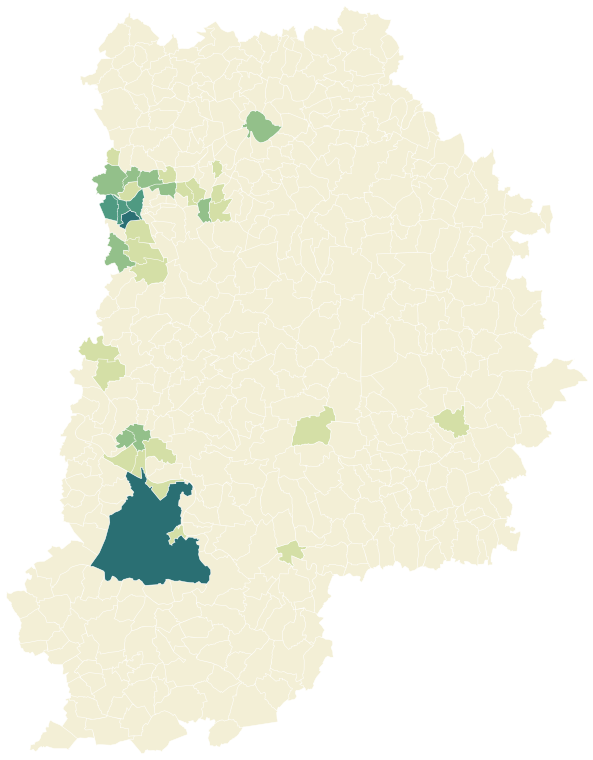
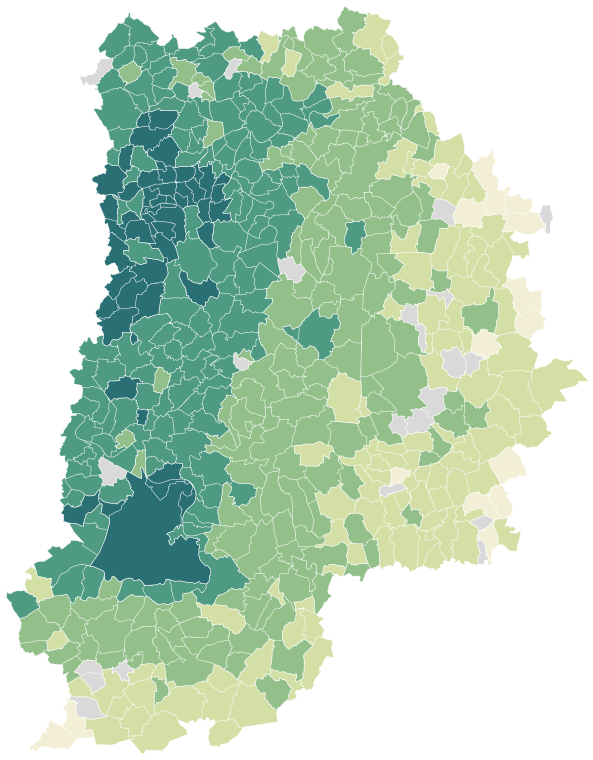
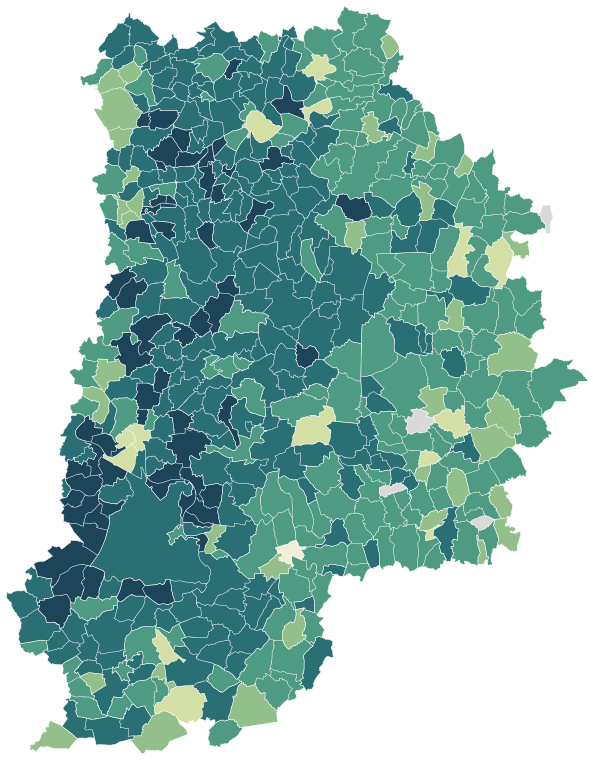
Sources: IGN and Insee, IRIS boundaries and Admin Express 2024 (Open Licence 2.0) · DGFiP property sales (DVF), data.gouv.fr statistics (Open Licence 2.0) · Insee, Filosofi 2021 income data (Open Licence 2.0) · © OpenStreetMap contributors (ODbL)
The 138 communes with more than 2,000 people.
Colour shows where each commune sits among the others in the table, from lowest to highest.
| Commune | Residents | Price per m² | Living standard | Home owners | Aged 75+ | Unemployment | Green 500 m | Services 15 min |
|---|---|---|---|---|---|---|---|---|
| Annet-sur-Marne | 3,329 | €3,690/m² | €29,060 | 78% | 6% | 6.1% | 25% | 14 |
| Avon | 13,526 | €3,000/m² | €24,160 | 51% | 12% | 12.0% | 38% | 74 |
| Bailly-Romainvilliers | 7,049 | €4,230/m² | €26,990 | 59% | 3% | 7.5% | 3% | 62 |
| Beautheil-Saints | 2,064 | €2,400/m² | €26,270 | 89% | 7% | 8.2% | 18% | 10 |
| Bois-le-Roi | 6,026 | €4,150/m² | €33,500 | 80% | 9% | 6.3% | 35% | 68 |
| Boissise-le-Roi | 3,828 | €2,990/m² | €29,200 | 81% | 15% | 8.1% | 7% | 32 |
| Boissy-le-Châtel | 3,313 | €2,500/m² | €25,070 | 88% | 7% | 9.2% | 1% | 13 |
| Bourron-Marlotte | 2,782 | €3,580/m² | €29,150 | 75% | 13% | 7.9% | 4% | 32 |
| Bray-sur-Seine | 2,378 | €1,780/m² | €20,690 | 45% | 14% | 19.0% | 12% | 38 |
| Brie-Comte-Robert | 18,999 | €3,620/m² | €25,040 | 53% | 7% | 10.1% | 7% | 41 |
| Brou-sur-Chantereine | 5,094 | €2,980/m² | €22,750 | 49% | 5% | 10.1% | 9% | 125 |
| Bussy-Saint-Georges | 26,334 | €4,490/m² | €26,270 | 53% | 3% | 10.2% | 34% | 39 |
| Cannes-Écluse | 2,742 | €2,360/m² | €23,840 | 75% | 11% | 7.0% | 16% | 22 |
| Cesson | 11,141 | €3,120/m² | €27,030 | 74% | 7% | 8.5% | 19% | 49 |
| Chailly-en-Bière | 2,172 | €3,040/m² | €27,330 | 75% | 9% | 7.9% | 0% | 25 |
| Champagne-sur-Seine | 6,491 | €2,500/m² | €21,180 | 47% | 7% | 15.6% | 31% | 44 |
| Champs-sur-Marne | 26,661 | €3,700/m² | €23,750 | 44% | 4% | 13.3% | 38% | 149 |
| Chanteloup-en-Brie | 4,166 | €3,900/m² | €27,450 | 62% | 7% | 7.9% | 1% | 56 |
| Chartrettes | 2,593 | €3,620/m² | €31,160 | 85% | 11% | 6.3% | 14% | 25 |
| Chauconin-Neufmontiers | 3,726 | €3,130/m² | €26,410 | 81% | 3% | 9.1% | 7% | 6 |
| Chaumes-en-Brie | 3,452 | €2,800/m² | €26,440 | 72% | 6% | 8.9% | 5% | 17 |
| Chelles | 54,372 | €3,740/m² | €23,830 | 57% | 8% | 11.1% | 16% | 131 |
| Chessy | 7,242 | €4,810/m² | €27,230 | 52% | 2% | 8.2% | 17% | 99 |
| Chevry-Cossigny | 4,019 | €3,630/m² | €28,480 | 76% | 5% | 7.3% | 8% | 35 |
| Château-Landon | 3,150 | €1,780/m² | €22,160 | 71% | 15% | 11.6% | 27% | 31 |
| Claye-Souilly | 12,381 | €3,880/m² | €27,510 | 63% | 9% | 9.3% | 20% | 31 |
| Collégien | 3,332 | €3,820/m² | €26,810 | 67% | 4% | 8.4% | 19% | 50 |
| Combs-la-Ville | 22,712 | €3,260/m² | €24,650 | 63% | 8% | 9.4% | 22% | 93 |
| Couilly-Pont-aux-Dames | 2,131 | €3,100/m² | €28,840 | 83% | 10% | 7.5% | 11% | 45 |
| Coulommiers | 15,696 | €2,750/m² | €21,030 | 41% | 11% | 13.9% | 25% | 45 |
| Coupvray | 3,008 | €4,090/m² | €30,190 | 82% | 7% | 6.9% | 48% | 49 |
| Courtry | 7,107 | €3,570/m² | €26,930 | 76% | 6% | 7.9% | 12% | 76 |
| Crécy-la-Chapelle | 4,881 | €3,250/m² | €26,890 | 67% | 9% | 6.9% | 14% | 55 |
| Crégy-lès-Meaux | 5,419 | €3,160/m² | €24,800 | 68% | 3% | 10.1% | 30% | 21 |
| Dammarie-les-Lys | 23,252 | €2,970/m² | €20,310 | 43% | 7% | 15.1% | 15% | 84 |
| Dammartin-en-Goële | 11,508 | €3,320/m² | €25,560 | 67% | 4% | 8.8% | 29% | 33 |
| Dampmart | 3,655 | €3,640/m² | €26,590 | 77% | 8% | 9.7% | 2% | 21 |
| Donnemarie-Dontilly | 2,726 | €1,900/m² | €23,170 | 73% | 12% | 11.4% | 6% | 20 |
| Esbly | 6,237 | €3,530/m² | €27,620 | 74% | 8% | 7.6% | 18% | 69 |
| Faremoutiers | 3,035 | €2,680/m² | €24,820 | 77% | 6% | 8.4% | 23% | 20 |
| Ferrières-en-Brie | 3,887 | €4,460/m² | €29,080 | 55% | 4% | 7.7% | 49% | 40 |
| Fontainebleau | 15,787 | €4,680/m² | €27,340 | 42% | 13% | 11.0% | 30% | 185 |
| Fontenay-Trésigny | 5,887 | €3,080/m² | €24,880 | 63% | 8% | 8.1% | 22% | 40 |
| Gretz-Armainvilliers | 8,682 | €3,500/m² | €24,260 | 57% | 7% | 10.9% | 62% | 20 |
| Grisy-Suisnes | 2,848 | €3,380/m² | €29,270 | 82% | 5% | 4.6% | 14% | 13 |
| Guignes | 4,434 | €2,970/m² | €24,510 | 70% | 5% | 8.0% | 15% | 31 |
| Guérard | 2,669 | €2,890/m² | €27,850 | 88% | 6% | 7.2% | 43% | 11 |
| Héricy | 2,511 | €3,190/m² | €29,650 | 86% | 11% | 7.9% | 15% | 40 |
| Jouarre | 4,262 | €2,270/m² | €23,900 | 71% | 11% | 9.0% | 12% | 21 |
| Jouy-sur-Morin | 2,221 | €1,990/m² | €23,150 | 78% | 8% | 14.6% | 15% | 11 |
| Juilly | 2,031 | €3,160/m² | €26,540 | 78% | 4% | 7.7% | 3% | 28 |
| La Chapelle-la-Reine | 2,236 | €2,460/m² | €24,530 | 71% | 10% | 8.7% | 0% | 20 |
| La Ferté-Gaucher | 4,762 | €1,790/m² | €19,200 | 42% | 13% | 19.2% | 9% | 49 |
| La Ferté-sous-Jouarre | 10,004 | €2,420/m² | €21,220 | 49% | 9% | 13.7% | 37% | 41 |
| La Grande-Paroisse | 2,899 | €2,210/m² | €23,940 | 85% | 10% | 10.3% | 1% | 30 |
| La Rochette | 3,919 | €2,700/m² | €27,950 | 53% | 8% | 10.1% | 15% | 95 |
| Lagny-sur-Marne | 21,433 | €4,040/m² | €25,220 | 55% | 8% | 12.0% | 6% | 114 |
| Le Châtelet-en-Brie | 4,231 | €2,780/m² | €26,670 | 79% | 8% | 6.9% | 2% | 40 |
| Le Mée-sur-Seine | 19,527 | €2,390/m² | €19,130 | 48% | 7% | 16.6% | 29% | 110 |
| Lieusaint | 14,096 | €3,370/m² | €24,290 | 48% | 2% | 11.5% | 7% | 28 |
| Livry-sur-Seine | 2,224 | €3,100/m² | €27,370 | 81% | 13% | 7.2% | 19% | 32 |
| Lizy-sur-Ourcq | 3,575 | €2,180/m² | €19,220 | 37% | 9% | 17.3% | 15% | 47 |
| Lognes | 14,678 | €3,730/m² | €22,290 | 53% | 3% | 9.9% | 33% | 188 |
| Longperrier | 2,911 | €3,250/m² | €25,180 | 43% | 3% | 8.7% | 6% | 49 |
| Lésigny | 7,015 | €3,670/m² | €31,100 | 85% | 10% | 6.3% | 41% | 32 |
| Magny-le-Hongre | 9,058 | €4,650/m² | €29,460 | 56% | 2% | 7.1% | 18% | 63 |
| Mareuil-lès-Meaux | 3,313 | €3,110/m² | €26,130 | 62% | 7% | 10.9% | 5% | 16 |
| Meaux | 56,659 | €3,200/m² | €20,010 | 37% | 6% | 14.5% | 13% | 109 |
| Melun | 43,685 | €2,980/m² | €19,260 | 27% | 6% | 15.0% | 10% | 137 |
| Mitry-Mory | 20,393 | €3,500/m² | €22,810 | 62% | 6% | 12.2% | 5% | 50 |
| Moissy-Cramayel | 18,498 | €3,250/m² | €22,780 | 56% | 3% | 11.4% | 11% | 70 |
| Montereau-Fault-Yonne | 21,840 | €2,050/m² | €16,280 | 28% | 8% | 20.2% | 14% | 81 |
| Montigny-sur-Loing | 2,634 | €3,410/m² | €28,710 | 80% | 10% | 8.3% | 15% | 24 |
| Montry | 3,872 | €3,650/m² | €28,360 | 85% | 8% | 5.5% | 9% | 43 |
| Montévrain | 14,847 | €4,590/m² | €26,710 | 51% | 2% | 7.6% | 29% | 90 |
| Moret-Loing-et-Orvanne | 12,576 | €2,860/m² | €26,620 | 71% | 10% | 8.8% | 50% | 36 |
| Mormant | 5,280 | €2,640/m² | €23,100 | 54% | 7% | 10.2% | 0% | 27 |
| Mouroux | 5,869 | €2,600/m² | €24,940 | 80% | 6% | 7.9% | 33% | 25 |
| Moussy-le-Neuf | 3,255 | €3,310/m² | €27,460 | 75% | 5% | 7.0% | 13% | 24 |
| Nandy | 6,322 | €3,110/m² | €24,330 | 64% | 4% | 11.1% | 56% | 36 |
| Nangis | 8,883 | €2,360/m² | €19,890 | 47% | 8% | 14.0% | 3% | 64 |
| Nanteuil-lès-Meaux | 7,054 | €3,070/m² | €25,510 | 70% | 6% | 7.5% | 23% | 39 |
| Nemours | 13,118 | €2,320/m² | €19,330 | 41% | 9% | 19.0% | 20% | 53 |
| Noisiel | 15,927 | €3,490/m² | €21,110 | 46% | 6% | 13.0% | 46% | 167 |
| Oissery | 2,488 | €3,010/m² | €26,690 | 84% | 2% | 7.3% | 4% | 12 |
| Othis | 6,741 | €3,290/m² | €26,870 | 77% | 6% | 9.2% | 4% | 27 |
| Ozoir-la-Ferrière | 20,969 | €4,000/m² | €27,270 | 65% | 7% | 9.9% | 20% | 91 |
| Ozouer-le-Voulgis | 2,002 | €3,030/m² | €27,940 | 87% | 4% | 6.7% | 13% | 18 |
| Perthes | 2,074 | €3,250/m² | €29,180 | 84% | 10% | 5.7% | 3% | 19 |
| Pommeuse | 3,039 | €2,600/m² | €25,660 | 85% | 5% | 8.2% | 31% | 1 |
| Pomponne | 4,149 | €4,260/m² | €27,180 | 54% | 6% | 9.8% | 11% | 105 |
| Pontault-Combault | 38,941 | €4,000/m² | €25,010 | 59% | 6% | 9.9% | 11% | 106 |
| Pontcarré | 2,149 | €3,720/m² | €28,180 | 80% | 7% | 6.0% | 48% | 16 |
| Presles-en-Brie | 2,342 | €3,280/m² | €28,540 | 81% | 5% | 6.5% | 11% | 20 |
| Pringy | 3,861 | €3,290/m² | €25,750 | 62% | 8% | 8.4% | 16% | 49 |
| Provins | 11,824 | €2,140/m² | €19,200 | 36% | 12% | 18.1% | 9% | 61 |
| Quincy-Voisins | 5,506 | €3,330/m² | €27,360 | 79% | 6% | 6.6% | 27% | 25 |
| Rebais | 2,291 | €2,020/m² | €21,460 | 62% | 11% | 12.9% | 8% | 15 |
| Roissy-en-Brie | 23,521 | €3,490/m² | €24,320 | 64% | 6% | 11.2% | 34% | 90 |
| Rozay-en-Brie | 2,840 | €2,840/m² | €25,690 | 62% | 10% | 8.4% | 1% | 19 |
| Rubelles | 3,450 | €2,930/m² | €25,420 | 76% | 8% | 8.7% | 60% | 14 |
| Réau | 2,045 | €3,700/m² | €25,660 | 67% | 5% | 8.0% | 5% | 8 |
| Saint-Fargeau-Ponthierry | 15,117 | €3,020/m² | €25,520 | 59% | 8% | 9.3% | 8% | 26 |
| Saint-Germain-Laval | 2,887 | €2,150/m² | €23,190 | 74% | 7% | 13.1% | 36% | 15 |
| Saint-Germain-sur-Morin | 3,892 | €3,540/m² | €28,340 | 81% | 7% | 6.1% | 17% | 54 |
| Saint-Mammès | 3,232 | €2,560/m² | €24,330 | 78% | 11% | 8.6% | 7% | 41 |
| Saint-Mard | 3,853 | €3,280/m² | €26,890 | 79% | 5% | 9.9% | 4% | 31 |
| Saint-Pathus | 6,478 | €3,020/m² | €26,790 | 84% | 4% | 7.7% | 5% | 33 |
| Saint-Pierre-lès-Nemours | 5,424 | €2,310/m² | €24,900 | 78% | 14% | 10.6% | 48% | 17 |
| Saint-Soupplets | 3,586 | €3,000/m² | €25,030 | 71% | 7% | 7.7% | 4% | 29 |
| Saint-Thibault-des-Vignes | 6,793 | €3,800/m² | €26,940 | 69% | 5% | 12.6% | 14% | 41 |
| Samois-sur-Seine | 2,066 | €3,610/m² | €32,540 | 77% | 15% | 10.8% | 9% | 45 |
| Samoreau | 2,409 | €3,060/m² | €28,840 | 74% | 10% | 9.0% | 9% | 37 |
| Savigny-le-Temple | 30,630 | €2,870/m² | €22,240 | 58% | 4% | 13.1% | 15% | 48 |
| Serris | 9,988 | €4,890/m² | €25,790 | 40% | 5% | 8.1% | 33% | 127 |
| Servon | 3,430 | €3,730/m² | €28,020 | 82% | 7% | 7.2% | 30% | 51 |
| Soignolles-en-Brie | 2,024 | €3,110/m² | €28,470 | 86% | 5% | 6.4% | 16% | 13 |
| Souppes-sur-Loing | 4,974 | €1,840/m² | €20,430 | 63% | 9% | 16.2% | 5% | 20 |
| Thomery | 3,417 | €3,120/m² | €29,480 | 87% | 10% | 6.6% | 3% | 42 |
| Thorigny-sur-Marne | 10,405 | €3,630/m² | €25,580 | 57% | 6% | 10.2% | 6% | 94 |
| Torcy | 22,939 | €3,600/m² | €21,830 | 47% | 5% | 12.3% | 28% | 158 |
| Tournan-en-Brie | 8,324 | €3,600/m² | €26,380 | 57% | 7% | 8.8% | 14% | 45 |
| Trilport | 5,107 | €2,980/m² | €25,450 | 74% | 8% | 10.0% | 7% | 31 |
| Vaires-sur-Marne | 13,791 | €4,160/m² | €26,430 | 61% | 9% | 10.2% | 29% | 84 |
| Varennes-sur-Seine | 3,724 | €2,230/m² | €21,350 | 61% | 10% | 15.2% | 17% | 43 |
| Varreddes | 2,166 | €2,940/m² | €25,970 | 72% | 8% | 8.0% | 1% | 12 |
| Vaux-le-Pénil | 11,378 | €2,800/m² | €26,950 | 68% | 8% | 8.6% | 8% | 62 |
| Verneuil-l'Étang | 3,211 | €2,790/m² | €25,360 | 65% | 5% | 9.8% | 18% | 20 |
| Vernou-la-Celle-sur-Seine | 2,621 | €2,480/m² | €25,910 | 85% | 6% | 9.1% | 10% | 26 |
| Vert-Saint-Denis | 9,057 | €3,150/m² | €25,270 | 70% | 7% | 8.7% | 28% | 12 |
| Villenoy | 5,073 | €3,380/m² | €24,730 | 55% | 5% | 9.2% | 13% | 42 |
| Villeparisis | 26,794 | €3,350/m² | €22,650 | 55% | 5% | 11.2% | 11% | 50 |
| Villevaudé | 2,114 | €3,270/m² | €28,000 | 87% | 7% | 7.4% | 50% | 10 |
| Villiers-sur-Morin | 2,067 | €3,110/m² | €28,030 | 87% | 6% | 6.4% | 18% | 7 |
| Vulaines-sur-Seine | 2,720 | €3,130/m² | €30,280 | 90% | 12% | 7.0% | 33% | 22 |
| Égreville | 2,164 | €1,810/m² | €22,690 | 76% | 10% | 12.9% | 11% | 19 |
| Émerainville | 7,536 | €4,190/m² | €26,240 | 64% | 5% | 9.6% | 51% | 53 |
| Évry-Grégy-sur-Yerre | 3,236 | €3,350/m² | €29,590 | 91% | 6% | 5.0% | 23% | 16 |
Sources: Insee, 2022 population census (sub-municipal files, Open Licence 2.0) · DGFiP property sales (DVF), data.gouv.fr statistics (Open Licence 2.0) · Insee, Filosofi 2021 income data (Open Licence 2.0) · © OpenStreetMap contributors (ODbL)
People.
1,452,399 residents and 588,353 households at the 2022 census, next to the département figure.
Source: Insee, 2022 population census (sub-municipal files, Open Licence 2.0)
Homes.
651,454 homes, 90% of them main residences, with 4.0 rooms on average.
When main homes were built
Source: Insee, 2022 population census (sub-municipal files, Open Licence 2.0)
Property prices.
89,414 house and flat sales over five years.
Median prices from sales published in France’s Demandes de valeurs foncières (DVF) over ten half-years, for sales of a single property. Individual sales are not shown. A median is only given where there were at least ten sales.
Source: DGFiP property sales (DVF), data.gouv.fr statistics (Open Licence 2.0)
Income and work.
Work and qualifications at the 2022 census.
Sources: Insee, 2022 population census (sub-municipal files, Open Licence 2.0)
Health, shops and services.
Facilities and services in Seine-et-Marne on 1 January 2025, from Insee’s permanent database of facilities.
Insee’s permanent database of facilities lists the shops, services and health professionals present in each commune on 1 January. Health professionals in private practice are counted one by one; several may work at the same address.
Source: Insee, permanent database of facilities 2025 (Open Licence 2.0)
Natural and industrial hazards.
Share of the département’s 507 communes exposed to each major hazard, and natural-disaster declarations since 1982.
Natural-disaster declarations by type
A natural-disaster declaration (arrêté CatNat) lets insurers pay out for the damage. The count reflects past events, not a forecast of future risk. The list of hazards comes from each département’s major-risk file; a prevention plan in force limits building in exposed zones.
Source: Géorisques, GASPAR database (Open Licence 2.0), as of 5 October 2026