Vendée
Vendée has 706,343 residents in 255 communes. Over five years, homes sold for a median €2,470/m², from €1,180/m² in Terval to €5,960/m² in L'Île-d'Yeu among communes of more than 2,000 people. 72% of households own their main home.
Four maps of Vendée.
Each commune is coloured by its value; every map uses the same colour scale, from lowest to highest. Grey: not published.
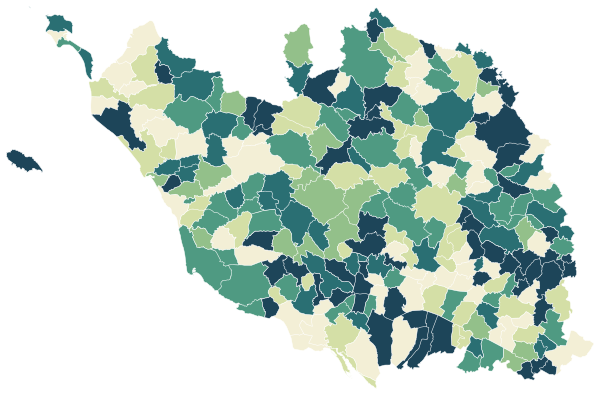
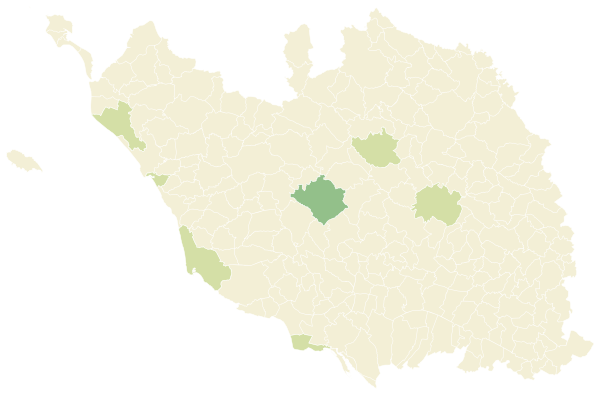
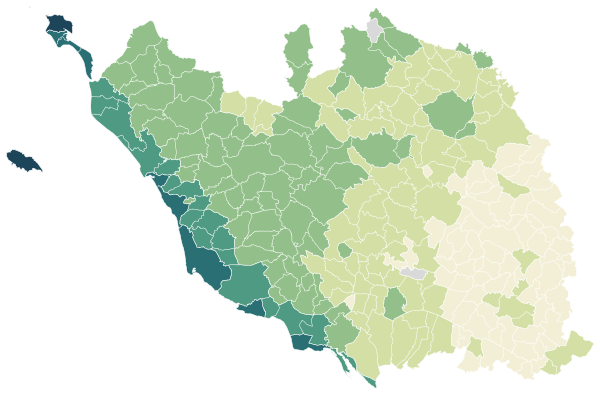
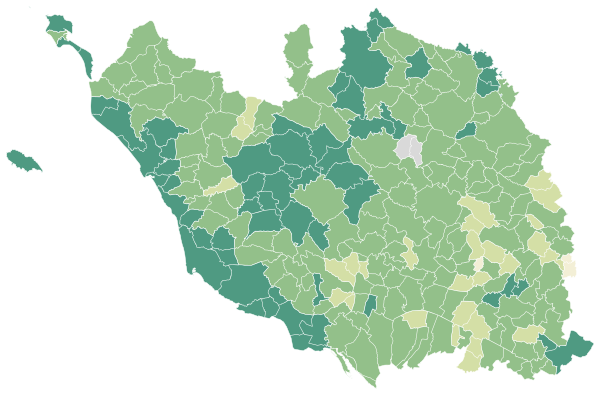
Sources: IGN and Insee, IRIS boundaries and Admin Express 2024 (Open Licence 2.0) · DGFiP property sales (DVF), data.gouv.fr statistics (Open Licence 2.0) · Insee, Filosofi 2021 income data (Open Licence 2.0) · © OpenStreetMap contributors (ODbL)
The 101 communes with more than 2,000 people.
Colour shows where each commune sits among the others in the table, from lowest to highest.
| Commune | Residents | Price per m² | Living standard | Home owners | Aged 75+ | Unemployment | Green 500 m | Services 15 min |
|---|---|---|---|---|---|---|---|---|
| Aizenay | 10,218 | €2,500/m² | €23,030 | 74% | 7% | 7.8% | 2% | 0 |
| Angles | 2,966 | €2,780/m² | €23,030 | 75% | 19% | 19.7% | 3% | 30 |
| Apremont | 2,028 | €2,150/m² | €21,450 | 84% | 8% | 9.0% | 25% | 17 |
| Aubigny-Les Clouzeaux | 7,129 | €2,390/m² | €23,950 | 80% | 8% | 6.6% | 25% | 35 |
| Beaulieu-sous-la-Roche | 2,366 | €2,140/m² | €23,060 | 78% | 9% | 6.3% | 18% | 17 |
| Beaurepaire | 2,406 | €1,930/m² | €22,390 | 78% | 7% | 4.4% | 3% | 17 |
| Beauvoir-sur-Mer | 3,955 | €2,430/m² | €21,630 | 76% | 20% | 11.5% | 3% | 43 |
| Bellevigny | 6,239 | €2,240/m² | €23,800 | 76% | 6% | 4.9% | 12% | 40 |
| Benet | 4,059 | €1,610/m² | €23,400 | 78% | 12% | 6.7% | 2% | 36 |
| Bois-de-Céné | 2,215 | €2,180/m² | €22,120 | 81% | 10% | 7.7% | 22% | 13 |
| Bouin | 2,169 | €2,100/m² | €21,850 | 80% | 18% | 7.5% | 0% | 25 |
| Bournezeau | 3,471 | €1,710/m² | €22,660 | 75% | 8% | 5.8% | 20% | 26 |
| Brem-sur-Mer | 2,933 | €3,300/m² | €23,010 | 79% | 20% | 10.1% | 6% | 28 |
| Bretignolles-sur-Mer | 5,139 | €3,900/m² | €24,800 | 77% | 17% | 13.6% | 0% | 57 |
| Challans | 22,890 | €2,660/m² | €22,600 | 62% | 16% | 11.5% | 21% | 34 |
| Chantonnay | 8,518 | €1,670/m² | €21,500 | 72% | 10% | 9.5% | 8% | 90 |
| Chanverrie | 5,580 | €1,960/m² | €22,810 | 75% | 10% | 5.7% | 6% | 27 |
| Chauché | 2,559 | €1,720/m² | €23,180 | 80% | 8% | 5.0% | 40% | 13 |
| Chavagnes-en-Paillers | 3,648 | €1,880/m² | €22,100 | 75% | 12% | 5.8% | 47% | 26 |
| Commequiers | 3,708 | €2,540/m² | €21,770 | 77% | 12% | 10.7% | 5% | 19 |
| Coëx | 3,416 | €2,420/m² | €21,870 | 78% | 12% | 11.0% | 13% | 27 |
| Cugand | 3,746 | €2,430/m² | €24,350 | 82% | 11% | 5.6% | 28% | 46 |
| Dompierre-sur-Yon | 4,535 | €2,330/m² | €24,310 | 81% | 5% | 5.1% | 31% | 20 |
| Essarts-en-Bocage | 6,835 | €2,010/m² | €22,670 | 73% | 7% | 6.3% | 18% | 61 |
| Fontenay-le-Comte | 13,806 | €1,500/m² | €21,440 | 56% | 18% | 13.6% | 10% | 43 |
| Froidfond | 2,128 | €2,170/m² | €22,020 | 77% | 4% | 5.4% | 19% | 13 |
| Givrand | 2,216 | €3,240/m² | €24,110 | 80% | 17% | 10.0% | 31% | 13 |
| Grosbreuil | 2,216 | €2,430/m² | €22,590 | 82% | 7% | 7.5% | 1% | 12 |
| Jard-sur-Mer | 3,046 | €3,650/m² | €25,160 | 80% | 27% | 13.9% | 16% | 49 |
| L'Aiguillon-la-Presqu'île | 2,808 | €2,860/m² | €22,590 | 76% | 28% | 14.2% | 7% | 52 |
| L'Aiguillon-sur-Vie | 2,207 | €2,770/m² | €22,540 | 83% | 14% | 8.2% | 14% | 9 |
| L'Herbergement | 3,437 | €2,190/m² | €23,670 | 74% | 7% | 5.2% | 4% | 41 |
| L'Île-d'Olonne | 2,805 | €3,240/m² | €23,620 | 85% | 9% | 8.9% | 11% | 21 |
| L'Île-d'Yeu | 4,887 | €5,960/m² | €23,440 | 81% | 15% | 11.9% | 48% | 12 |
| La Barre-de-Monts | 2,356 | €3,000/m² | €21,960 | 76% | 15% | 10.0% | 10% | 19 |
| La Boissière-de-Montaigu | 2,295 | €1,770/m² | €22,490 | 81% | 7% | 5.2% | 6% | 15 |
| La Bruffière | 4,015 | €2,030/m² | €22,550 | 80% | 8% | 4.6% | 8% | 27 |
| La Chaize-le-Vicomte | 3,883 | €1,960/m² | €23,380 | 72% | 8% | 6.5% | 11% | 25 |
| La Châtaigneraie | 2,590 | €1,190/m² | €20,080 | 63% | 18% | 13.5% | 18% | 36 |
| La Ferrière | 5,411 | €2,130/m² | €23,570 | 78% | 7% | 7.3% | 5% | 38 |
| La Garnache | 5,413 | €2,330/m² | €22,810 | 81% | 8% | 6.6% | 23% | 40 |
| La Gaubretière | 3,223 | €1,940/m² | €22,910 | 80% | 9% | 5.6% | 17% | 24 |
| La Roche-sur-Yon | 54,699 | €2,410/m² | €22,310 | 48% | 11% | 12.2% | 11% | 126 |
| La Tranche-sur-Mer | 3,129 | €3,930/m² | €24,620 | 75% | 23% | 15.0% | 1% | 67 |
| Landeronde | 2,285 | €2,360/m² | €23,900 | 85% | 6% | 6.0% | 26% | 21 |
| Le Boupère | 3,170 | €1,600/m² | €21,660 | 79% | 11% | 4.4% | 3% | 19 |
| Le Champ-Saint-Père | 2,041 | €1,900/m² | €20,980 | 80% | 13% | 8.8% | 37% | 15 |
| Le Fenouiller | 4,978 | €3,200/m² | €24,570 | 84% | 13% | 8.1% | 22% | 27 |
| Le Perrier | 2,210 | €2,440/m² | €21,940 | 79% | 11% | 7.7% | 3% | 17 |
| Le Poiré-sur-Vie | 8,637 | €2,270/m² | €23,470 | 77% | 7% | 5.1% | 15% | 56 |
| Les Achards | 5,451 | €2,570/m² | €22,950 | 74% | 9% | 6.9% | 9% | 59 |
| Les Brouzils | 2,916 | €1,910/m² | €23,210 | 82% | 10% | 5.3% | 27% | 34 |
| Les Epesses | 2,984 | €1,890/m² | €22,220 | 77% | 7% | 5.6% | 3% | 35 |
| Les Herbiers | 16,589 | €2,330/m² | €22,930 | 66% | 9% | 7.5% | 25% | 14 |
| Les Landes-Genusson | 2,572 | €1,940/m² | €23,030 | 81% | 10% | 4.8% | 1% | 14 |
| Les Lucs-sur-Boulogne | 3,671 | €2,030/m² | €22,740 | 75% | 10% | 5.2% | 7% | 34 |
| Les Sables-d'Olonne | 48,740 | €4,290/m² | €24,520 | 65% | 20% | 11.8% | 17% | 74 |
| Longeville-sur-Mer | 2,442 | €3,170/m² | €23,710 | 78% | 21% | 11.9% | 3% | 30 |
| Luçon | 9,450 | €2,000/m² | €21,510 | 59% | 18% | 11.6% | 44% | 9 |
| Mareuil-sur-Lay-Dissais | 2,773 | €1,730/m² | €22,110 | 76% | 14% | 13.1% | 23% | 33 |
| Montaigu-Vendée | 20,754 | €2,380/m² | €24,050 | 70% | 8% | 6.3% | 17% | 37 |
| Montréverd | 3,833 | €1,950/m² | €22,970 | 80% | 6% | 4.8% | 33% | 11 |
| Mortagne-sur-Sèvre | 6,065 | €2,100/m² | €23,260 | 74% | 10% | 6.2% | 24% | 1 |
| Mouchamps | 2,986 | €1,640/m² | €21,950 | 76% | 8% | 5.4% | 28% | 26 |
| Mouilleron-le-Captif | 5,209 | €2,530/m² | €25,480 | 85% | 7% | 5.6% | 15% | 50 |
| Moutiers-les-Mauxfaits | 2,341 | €2,320/m² | €22,210 | 65% | 14% | 8.7% | 8% | 44 |
| Nalliers | 2,372 | €1,590/m² | €21,660 | 80% | 12% | 9.7% | 8% | 15 |
| Nesmy | 3,056 | €2,130/m² | €23,500 | 80% | 7% | 4.9% | 27% | 25 |
| Nieul-le-Dolent | 2,546 | €2,130/m² | €22,750 | 78% | 10% | 5.9% | 15% | 18 |
| Noirmoutier-en-l'Île | 4,502 | €5,400/m² | €24,050 | 74% | 18% | 11.6% | 24% | 56 |
| Notre-Dame-de-Monts | 2,293 | €3,490/m² | €23,070 | 73% | 20% | 10.9% | 5% | 54 |
| Notre-Dame-de-Riez | 2,179 | €2,650/m² | €23,010 | 77% | 13% | 11.4% | 6% | 11 |
| Pouzauges | 5,641 | €1,450/m² | €22,320 | 70% | 11% | 9.4% | 40% | 40 |
| Rives de l'Yon | 4,285 | €1,940/m² | €22,800 | 84% | 9% | 6.4% | 11% | 22 |
| Rives-d'Autise | 2,054 | €1,290/m² | €22,460 | 77% | 12% | 7.1% | 16% | 18 |
| Rocheservière | 3,571 | €2,120/m² | €22,360 | 75% | 9% | 5.4% | 28% | 34 |
| Saint-Christophe-du-Ligneron | 2,653 | €2,150/m² | €21,750 | 72% | 10% | 10.9% | 26% | 18 |
| Saint-Denis-la-Chevasse | 2,425 | €1,880/m² | €22,810 | 77% | 8% | 4.5% | 17% | 23 |
| Saint-Fulgent | 3,924 | €1,790/m² | €22,390 | 72% | 11% | 6.4% | 21% | 32 |
| Saint-Gervais | 2,752 | €2,370/m² | €22,210 | 80% | 10% | 6.9% | 7% | 18 |
| Saint-Gilles-Croix-de-Vie | 8,140 | €4,360/m² | €24,080 | 59% | 22% | 14.0% | 10% | 74 |
| Saint-Hilaire-de-Riez | 12,923 | €3,380/m² | €23,920 | 72% | 19% | 12.2% | 8% | 24 |
| Saint-Jean-de-Monts | 8,809 | €3,290/m² | €23,110 | 70% | 19% | 14.2% | 37% | 65 |
| Saint-Julien-des-Landes | 2,018 | €2,540/m² | €22,160 | 79% | 10% | 7.5% | 19% | 19 |
| Saint-Laurent-sur-Sèvre | 3,613 | €2,000/m² | €23,630 | 72% | 14% | 5.9% | 35% | 47 |
| Saint-Martin-des-Noyers | 2,540 | €1,790/m² | €22,930 | 77% | 10% | 6.9% | 6% | 15 |
| Saint-Mathurin | 2,443 | €2,870/m² | €23,210 | 80% | 9% | 6.5% | 0% | 13 |
| Saint-Michel-en-l'Herm | 2,347 | €1,970/m² | €22,010 | 77% | 18% | 13.6% | 3% | 23 |
| Saint-Philbert-de-Bouaine | 3,622 | €2,250/m² | €22,110 | 80% | 6% | 5.8% | 12% | 25 |
| Saint-Étienne-du-Bois | 2,251 | €1,950/m² | €21,360 | 81% | 9% | 6.8% | 34% | 16 |
| Sainte-Flaive-des-Loups | 2,547 | €2,350/m² | €23,380 | 77% | 6% | 7.8% | 19% | 19 |
| Sainte-Foy | 2,592 | €3,000/m² | €23,920 | 87% | 7% | 5.7% | 18% | 18 |
| Sainte-Gemme-la-Plaine | 2,074 | €1,720/m² | €22,960 | 77% | 11% | 5.7% | 4% | 18 |
| Sainte-Hermine | 2,962 | €1,540/m² | €21,150 | 68% | 12% | 10.1% | 23% | 36 |
| Sallertaine | 3,390 | €2,500/m² | €22,590 | 78% | 11% | 7.5% | 5% | 19 |
| Soullans | 4,535 | €2,610/m² | €23,260 | 77% | 12% | 7.7% | 2% | 17 |
| Sèvremont | 6,401 | €1,660/m² | €21,890 | 77% | 9% | 7.7% | 45% | 41 |
| Talmont-Saint-Hilaire | 8,327 | €3,390/m² | €24,530 | 79% | 14% | 9.2% | 20% | 2 |
| Terval | 2,173 | €1,180/m² | €21,320 | 81% | 9% | 8.6% | 25% | 6 |
| Treize-Septiers | 3,361 | €2,050/m² | €22,910 | 78% | 8% | 6.0% | 11% | 25 |
| Venansault | 4,743 | €2,340/m² | €23,820 | 84% | 7% | 6.0% | 22% | 38 |
Sources: Insee, 2022 population census (sub-municipal files, Open Licence 2.0) · DGFiP property sales (DVF), data.gouv.fr statistics (Open Licence 2.0) · Insee, Filosofi 2021 income data (Open Licence 2.0) · © OpenStreetMap contributors (ODbL)
People.
706,343 residents and 320,530 households at the 2022 census, next to the département figure.
Source: Insee, 2022 population census (sub-municipal files, Open Licence 2.0)
Homes.
447,695 homes, 72% of them main residences, with 4.4 rooms on average.
When main homes were built
Source: Insee, 2022 population census (sub-municipal files, Open Licence 2.0)
Property prices.
58,805 house and flat sales over five years.
Median prices from sales published in France’s Demandes de valeurs foncières (DVF) over ten half-years, for sales of a single property. Individual sales are not shown. A median is only given where there were at least ten sales.
Source: DGFiP property sales (DVF), data.gouv.fr statistics (Open Licence 2.0)
Income and work.
Work and qualifications at the 2022 census.
Sources: Insee, 2022 population census (sub-municipal files, Open Licence 2.0)
Health, shops and services.
Facilities and services in Vendée on 1 January 2025, from Insee’s permanent database of facilities.
Insee’s permanent database of facilities lists the shops, services and health professionals present in each commune on 1 January. Health professionals in private practice are counted one by one; several may work at the same address.
Source: Insee, permanent database of facilities 2025 (Open Licence 2.0)
Natural and industrial hazards.
Share of the département’s 258 communes exposed to each major hazard, and natural-disaster declarations since 1982.
Natural-disaster declarations by type
A natural-disaster declaration (arrêté CatNat) lets insurers pay out for the damage. The count reflects past events, not a forecast of future risk. The list of hazards comes from each département’s major-risk file; a prevention plan in force limits building in exposed zones.
Source: Géorisques, GASPAR database (Open Licence 2.0), as of 5 October 2026