Vienne
Vienne has 438,688 residents in 265 communes. Over five years, homes sold for a median €1,560/m², from €990/m² in Civray to €2,300/m² in Mignaloux-Beauvoir among communes of more than 2,000 people. 62% of households own their main home.
Four maps of Vienne.
Each commune is coloured by its value; every map uses the same colour scale, from lowest to highest. Grey: not published.
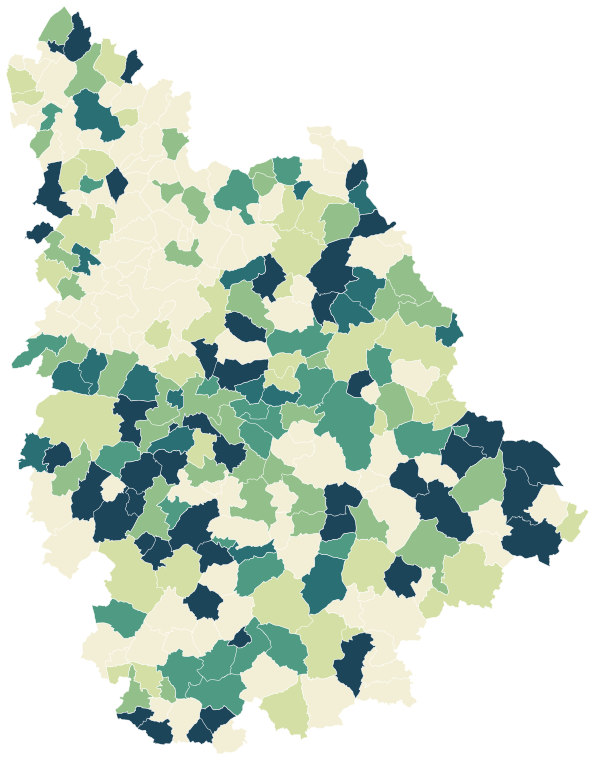
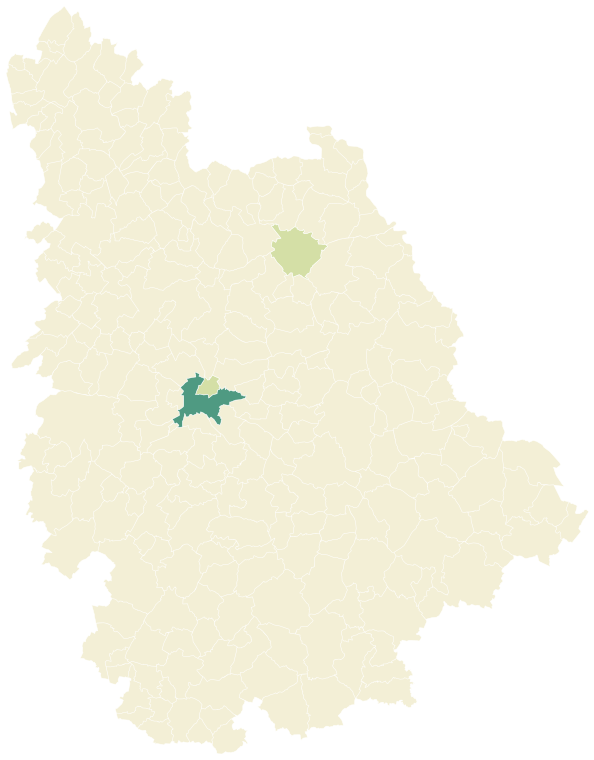
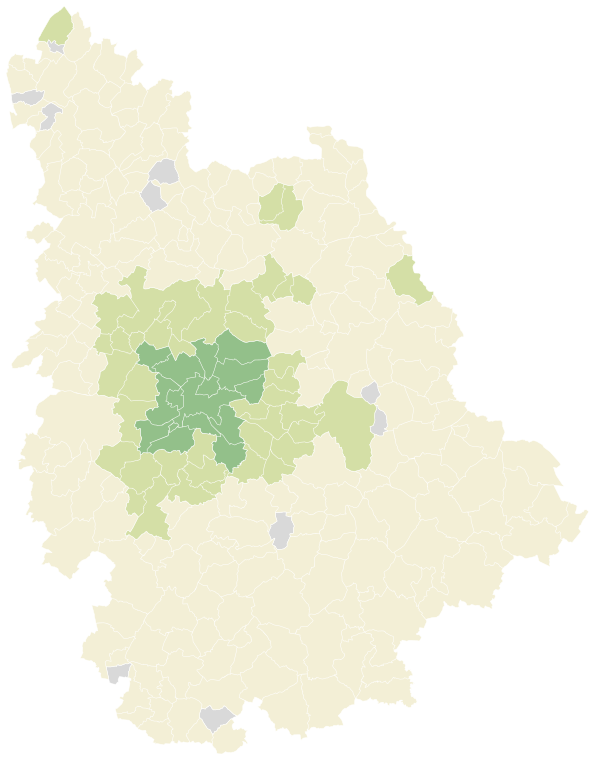
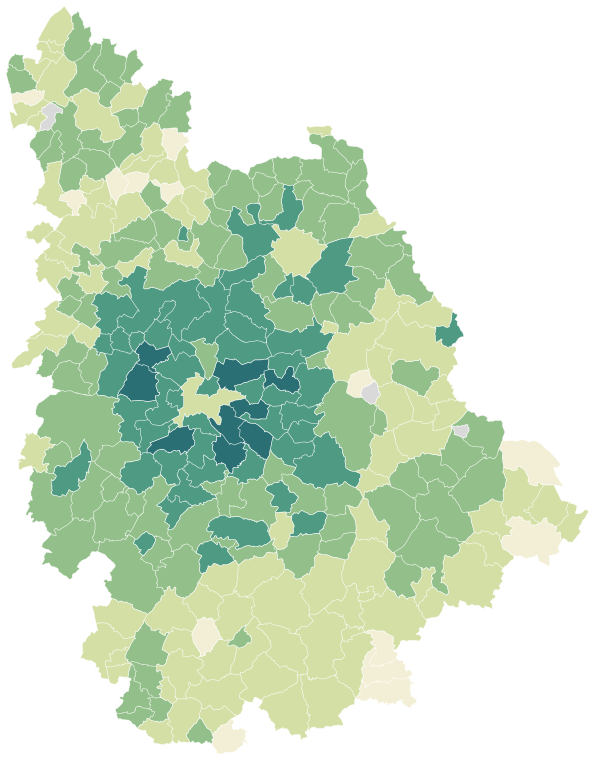
Sources: IGN and Insee, IRIS boundaries and Admin Express 2024 (Open Licence 2.0) · DGFiP property sales (DVF), data.gouv.fr statistics (Open Licence 2.0) · Insee, Filosofi 2021 income data (Open Licence 2.0) · © OpenStreetMap contributors (ODbL)
The 47 communes with more than 2,000 people.
Colour shows where each commune sits among the others in the table, from lowest to highest.
| Commune | Residents | Price per m² | Living standard | Home owners | Aged 75+ | Unemployment | Green 500 m | Services 15 min |
|---|---|---|---|---|---|---|---|---|
| Avanton | 2,227 | €1,910/m² | €24,790 | 82% | 7% | 4.6% | 1% | 25 |
| Beaumont Saint-Cyr | 2,941 | €1,580/m² | €23,350 | 79% | 9% | 8.2% | 11% | 11 |
| Boivre-la-Vallée | 3,041 | €1,280/m² | €22,050 | 83% | 8% | 7.1% | 6% | 11 |
| Bonneuil-Matours | 2,096 | €1,490/m² | €23,800 | 75% | 8% | 9.6% | 20% | 30 |
| Buxerolles | 10,253 | €2,070/m² | €23,600 | 55% | 12% | 12.7% | 17% | 67 |
| Chasseneuil-du-Poitou | 4,776 | €2,060/m² | €22,800 | 45% | 9% | 11.2% | 37% | 58 |
| Chauvigny | 7,037 | €1,530/m² | €22,230 | 63% | 16% | 9.7% | 18% | 6 |
| Châtellerault | 31,105 | €1,290/m² | €19,940 | 53% | 15% | 18.8% | 9% | 77 |
| Cissé | 2,875 | €2,020/m² | €25,930 | 83% | 8% | 5.7% | 0% | 18 |
| Civray | 2,543 | €990/m² | €20,090 | 62% | 28% | 16.3% | 13% | 38 |
| Dangé-Saint-Romain | 2,968 | €1,240/m² | €21,640 | 71% | 14% | 10.9% | 2% | 23 |
| Dissay | 3,143 | €1,710/m² | €23,330 | 75% | 8% | 8.7% | 52% | 18 |
| Fontaine-le-Comte | 3,971 | €2,120/m² | €25,330 | 78% | 12% | 6.7% | 13% | 42 |
| Iteuil | 2,989 | €1,790/m² | €24,080 | 76% | 9% | 5.8% | 40% | 15 |
| Jaunay-Marigny | 7,597 | €1,760/m² | €23,340 | 62% | 9% | 7.9% | 7% | 36 |
| Lencloître | 2,490 | €1,280/m² | €20,480 | 68% | 15% | 8.8% | 14% | 35 |
| Ligugé | 3,429 | €2,040/m² | €25,710 | 79% | 12% | 6.6% | 30% | 31 |
| Loudun | 6,791 | €1,080/m² | €20,070 | 60% | 16% | 11.7% | 24% | 29 |
| Lusignan | 2,556 | €1,210/m² | €21,730 | 68% | 17% | 8.2% | 41% | 42 |
| Lussac-les-Châteaux | 2,261 | €1,160/m² | €20,900 | 67% | 19% | 10.6% | 11% | 33 |
| Mignaloux-Beauvoir | 5,224 | €2,300/m² | €27,550 | 60% | 8% | 6.2% | 13% | 30 |
| Migné-Auxances | 6,276 | €2,020/m² | €24,800 | 71% | 11% | 8.0% | 5% | 15 |
| Mirebeau | 2,144 | €1,070/m² | €19,730 | 59% | 14% | 14.0% | 2% | 29 |
| Montamisé | 3,710 | €2,250/m² | €26,820 | 78% | 9% | 5.6% | 31% | 26 |
| Montmorillon | 5,867 | €1,090/m² | €21,410 | 62% | 20% | 12.7% | 32% | 23 |
| Naintré | 5,954 | €1,580/m² | €22,640 | 71% | 13% | 9.0% | 40% | 26 |
| Neuville-de-Poitou | 5,465 | €1,750/m² | €23,290 | 61% | 13% | 7.5% | 6% | 42 |
| Nieuil-l'Espoir | 2,680 | €1,840/m² | €24,380 | 80% | 9% | 4.7% | 12% | 34 |
| Nouaillé-Maupertuis | 2,955 | €2,180/m² | €27,260 | 85% | 9% | 4.8% | 58% | 33 |
| Poitiers | 89,472 | €2,170/m² | €20,150 | 30% | 8% | 16.0% | 13% | 162 |
| Quinçay | 2,113 | €1,990/m² | €25,920 | 90% | 9% | 6.2% | 30% | 16 |
| Roches-Prémarie-Andillé | 2,174 | €1,980/m² | €24,300 | 80% | 8% | 5.8% | 11% | 17 |
| Rouillé | 2,521 | €1,120/m² | €21,660 | 72% | 11% | 8.0% | 3% | 20 |
| Saint-Benoît | 7,306 | €2,150/m² | €25,320 | 62% | 14% | 8.7% | 35% | 36 |
| Saint-Georges-lès-Baillargeaux | 4,345 | €2,060/m² | €24,940 | 73% | 9% | 6.5% | 4% | 24 |
| Saint-Julien-l'Ars | 2,871 | €1,960/m² | €24,950 | 79% | 8% | 4.9% | 19% | 24 |
| Saint-Martin-la-Pallu | 5,663 | €1,620/m² | €23,200 | 83% | 7% | 7.6% | 2% | 15 |
| Scorbé-Clairvaux | 2,177 | €1,370/m² | €22,440 | 80% | 11% | 9.6% | 4% | 20 |
| Smarves | 2,941 | €1,970/m² | €25,020 | 82% | 13% | 6.8% | 9% | 23 |
| Sèvres-Anxaumont | 2,354 | €1,960/m² | €26,530 | 79% | 13% | 4.8% | 15% | 14 |
| Thuré | 2,787 | €1,390/m² | €23,310 | 83% | 13% | 7.9% | 0% | 7 |
| Valdivienne | 2,728 | €1,280/m² | €23,360 | 80% | 11% | 6.5% | 2% | 21 |
| Valence-en-Poitou | 4,323 | €1,070/m² | €21,060 | 76% | 13% | 8.6% | 10% | 31 |
| Vivonne | 4,505 | €1,620/m² | €22,530 | 63% | 10% | 9.3% | 14% | 30 |
| Vouillé | 3,707 | €1,720/m² | €23,240 | 72% | 11% | 7.3% | 11% | 32 |
| Vouneuil-sous-Biard | 6,245 | €2,110/m² | €25,280 | 72% | 9% | 7.5% | 14% | 50 |
| Vouneuil-sur-Vienne | 2,278 | €1,390/m² | €22,710 | 78% | 11% | 8.6% | 1% | 22 |
Sources: Insee, 2022 population census (sub-municipal files, Open Licence 2.0) · DGFiP property sales (DVF), data.gouv.fr statistics (Open Licence 2.0) · Insee, Filosofi 2021 income data (Open Licence 2.0) · © OpenStreetMap contributors (ODbL)
People.
438,688 residents and 209,079 households at the 2022 census, next to the département figure.
Source: Insee, 2022 population census (sub-municipal files, Open Licence 2.0)
Homes.
246,776 homes, 85% of them main residences, with 4.2 rooms on average.
When main homes were built
Source: Insee, 2022 population census (sub-municipal files, Open Licence 2.0)
Property prices.
29,462 house and flat sales over five years.
Median prices from sales published in France’s Demandes de valeurs foncières (DVF) over ten half-years, for sales of a single property. Individual sales are not shown. A median is only given where there were at least ten sales.
Source: DGFiP property sales (DVF), data.gouv.fr statistics (Open Licence 2.0)
Income and work.
Work and qualifications at the 2022 census.
Sources: Insee, 2022 population census (sub-municipal files, Open Licence 2.0)
Health, shops and services.
Facilities and services in Vienne on 1 January 2025, from Insee’s permanent database of facilities.
Insee’s permanent database of facilities lists the shops, services and health professionals present in each commune on 1 January. Health professionals in private practice are counted one by one; several may work at the same address.
Source: Insee, permanent database of facilities 2025 (Open Licence 2.0)
Natural and industrial hazards.
Share of the département’s 266 communes exposed to each major hazard, and natural-disaster declarations since 1982.
Natural-disaster declarations by type
A natural-disaster declaration (arrêté CatNat) lets insurers pay out for the damage. The count reflects past events, not a forecast of future risk. The list of hazards comes from each département’s major-risk file; a prevention plan in force limits building in exposed zones.
Source: Géorisques, GASPAR database (Open Licence 2.0), as of 5 October 2026