Yvelines
Yvelines has 1,470,778 residents in 259 communes. Over five years, homes sold for a median €4,010/m², from €2,440/m² in Bonnières-sur-Seine to €6,970/m² in Versailles among communes of more than 2,000 people. 58% of households own their main home.
Four maps of Yvelines.
Each commune is coloured by its value; every map uses the same colour scale, from lowest to highest. Grey: not published.
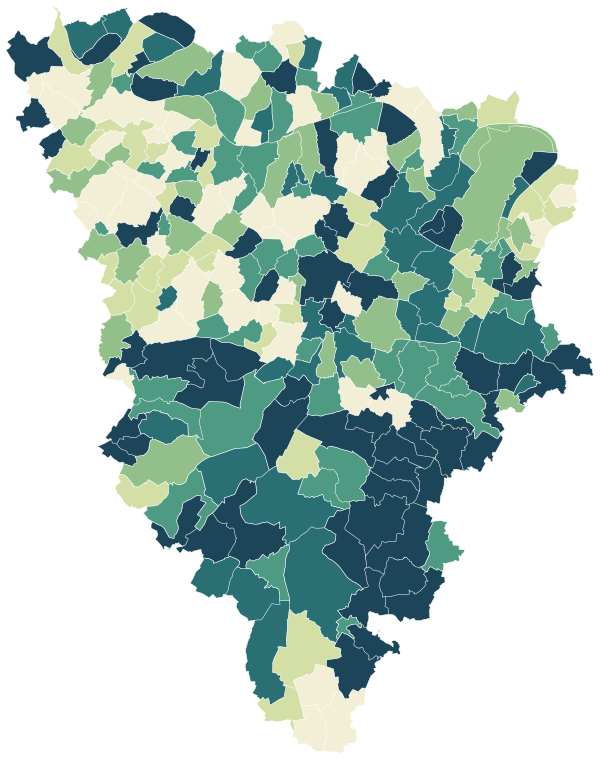
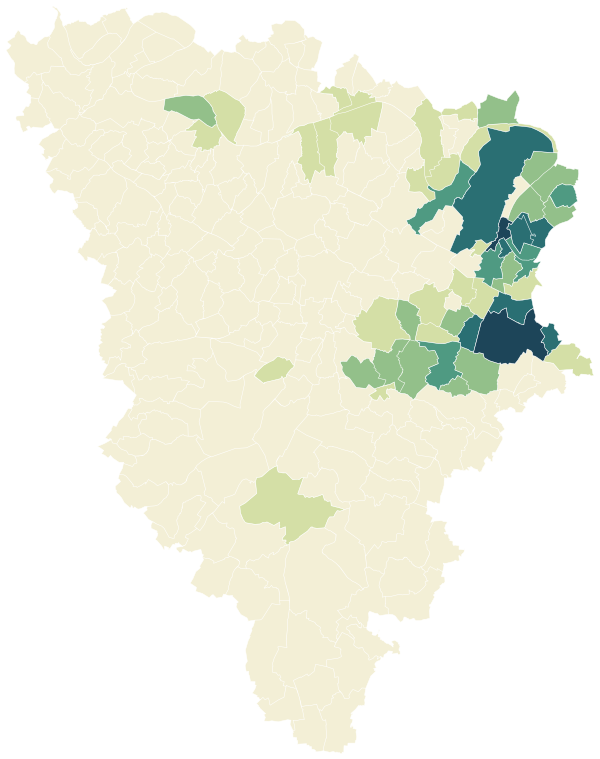
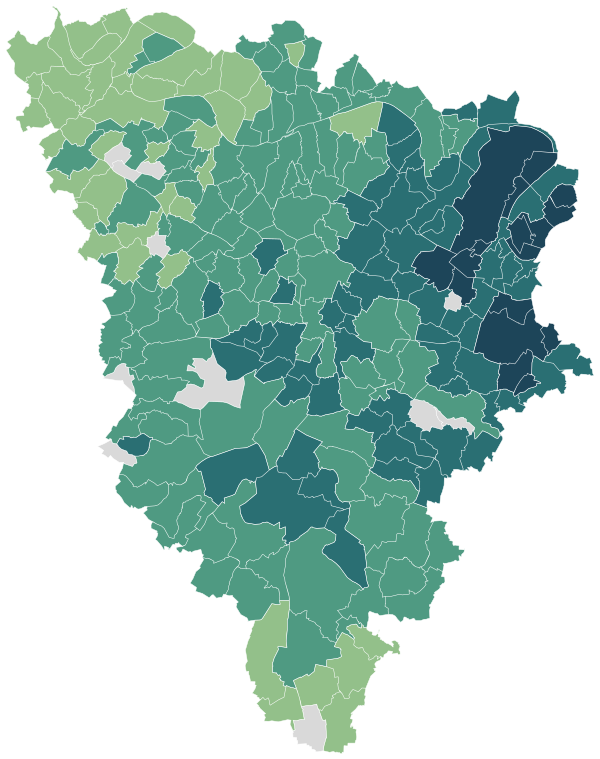
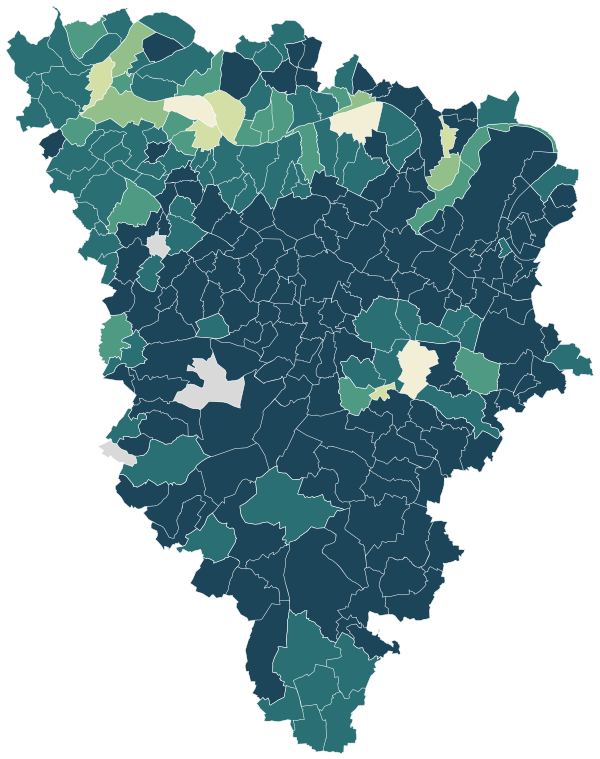
Sources: IGN and Insee, IRIS boundaries and Admin Express 2024 (Open Licence 2.0) · DGFiP property sales (DVF), data.gouv.fr statistics (Open Licence 2.0) · Insee, Filosofi 2021 income data (Open Licence 2.0) · © OpenStreetMap contributors (ODbL)
The 105 communes with more than 2,000 people.
Colour shows where each commune sits among the others in the table, from lowest to highest.
| Commune | Residents | Price per m² | Living standard | Home owners | Aged 75+ | Unemployment | Green 500 m | Services 15 min |
|---|---|---|---|---|---|---|---|---|
| Ablis | 3,814 | €2,730/m² | €26,630 | 77% | 6% | 8.1% | 5% | 32 |
| Achères | 21,663 | €3,870/m² | €23,420 | 42% | 6% | 11.7% | 15% | 94 |
| Andrésy | 13,663 | €3,520/m² | €29,500 | 66% | 9% | 7.0% | 21% | 37 |
| Aubergenville | 12,540 | €2,820/m² | €23,070 | 49% | 6% | 13.8% | 10% | 61 |
| Bailly | 3,690 | €4,480/m² | €38,230 | 78% | 13% | 5.3% | 8% | 84 |
| Beynes | 7,635 | €3,430/m² | €29,850 | 81% | 8% | 5.9% | 47% | 27 |
| Bois-d'Arcy | 16,225 | €3,610/m² | €27,520 | 64% | 7% | 5.6% | 27% | 76 |
| Bonnelles | 2,211 | €3,180/m² | €30,380 | 81% | 6% | 6.2% | 20% | 32 |
| Bonnières-sur-Seine | 5,077 | €2,440/m² | €20,720 | 43% | 8% | 14.5% | 11% | 55 |
| Bouafle | 2,222 | €3,310/m² | €28,450 | 78% | 8% | 8.3% | 3% | 13 |
| Bougival | 9,083 | €4,800/m² | €31,630 | 61% | 7% | 8.3% | 13% | 144 |
| Bréval | 2,031 | €2,730/m² | €27,310 | 73% | 10% | 7.8% | 7% | 20 |
| Buc | 5,868 | €5,340/m² | €35,400 | 63% | 10% | 5.9% | 51% | 41 |
| Buchelay | 3,364 | €3,160/m² | €24,140 | 63% | 9% | 12.2% | 3% | 41 |
| Carrières-sous-Poissy | 19,951 | €3,890/m² | €22,570 | 38% | 4% | 12.3% | 29% | 70 |
| Carrières-sur-Seine | 15,002 | €5,310/m² | €32,680 | 65% | 5% | 8.9% | 6% | 128 |
| Chambourcy | 5,826 | €4,200/m² | €32,930 | 64% | 10% | 8.1% | 32% | 33 |
| Chanteloup-les-Vignes | 10,793 | €3,080/m² | €19,940 | 43% | 5% | 17.8% | 28% | 52 |
| Chatou | 30,054 | €5,330/m² | €33,670 | 61% | 8% | 8.3% | 2% | 195 |
| Chevreuse | 5,531 | €4,120/m² | €33,230 | 65% | 10% | 8.1% | 75% | 33 |
| Coignières | 4,385 | €3,500/m² | €23,590 | 47% | 6% | 9.8% | 1% | 51 |
| Conflans-Sainte-Honorine | 36,306 | €3,980/m² | €27,320 | 61% | 8% | 9.2% | 7% | 121 |
| Croissy-sur-Seine | 10,580 | €6,180/m² | €38,780 | 61% | 9% | 8.2% | 6% | 175 |
| Ecquevilly | 4,090 | €3,260/m² | €26,630 | 66% | 8% | 10.9% | 3% | 24 |
| Feucherolles | 3,038 | €4,810/m² | €42,090 | 90% | 9% | 7.6% | 29% | 45 |
| Flins-sur-Seine | 2,436 | €3,150/m² | €25,620 | 74% | 9% | 6.8% | 40% | 62 |
| Follainville-Dennemont | 2,178 | €2,700/m² | €25,230 | 68% | 9% | 8.1% | 24% | 10 |
| Fontenay-le-Fleury | 13,640 | €3,690/m² | €26,260 | 56% | 8% | 9.6% | 12% | 110 |
| Freneuse | 4,299 | €2,610/m² | €22,930 | 67% | 8% | 14.4% | 9% | 21 |
| Gambais | 2,513 | €3,390/m² | €32,660 | 93% | 8% | 6.1% | 34% | 15 |
| Garancières | 2,577 | €3,480/m² | €31,350 | 81% | 7% | 5.5% | 2% | 9 |
| Gargenville | 7,848 | €3,220/m² | €25,030 | 68% | 8% | 10.1% | 19% | 39 |
| Guerville | 2,088 | €2,890/m² | €28,050 | 81% | 9% | 7.6% | 20% | 18 |
| Guyancourt | 29,758 | €4,040/m² | €24,720 | 36% | 4% | 11.6% | 33% | 126 |
| Hardricourt | 2,498 | €3,260/m² | €25,430 | 64% | 7% | 11.5% | 24% | 68 |
| Houdan | 3,716 | €3,280/m² | €24,540 | 46% | 12% | 10.4% | 13% | 50 |
| Houilles | 33,617 | €5,140/m² | €30,390 | 64% | 7% | 7.8% | 1% | 171 |
| Issou | 3,858 | €2,810/m² | €25,020 | 82% | 5% | 7.9% | 27% | 27 |
| Jouars-Pontchartrain | 5,965 | €3,840/m² | €32,860 | 81% | 10% | 6.0% | 29% | 47 |
| Jouy-en-Josas | 7,985 | €4,360/m² | €35,740 | 51% | 9% | 9.5% | 46% | 58 |
| Juziers | 4,040 | €2,970/m² | €26,040 | 73% | 7% | 8.9% | 4% | 35 |
| L'Étang-la-Ville | 4,915 | €5,000/m² | €40,580 | 79% | 11% | 7.2% | 7% | 57 |
| La Celle-Saint-Cloud | 20,440 | €4,250/m² | €29,510 | 53% | 9% | 9.5% | 37% | 98 |
| La Queue-les-Yvelines | 2,505 | €3,800/m² | €29,530 | 73% | 12% | 7.3% | 15% | 25 |
| La Verrière | 6,142 | €3,510/m² | €19,450 | 24% | 7% | 15.8% | 39% | 76 |
| Le Chesnay-Rocquencourt | 31,064 | €5,650/m² | €33,520 | 61% | 14% | 8.2% | 22% | 196 |
| Le Mesnil-Saint-Denis | 7,103 | €3,700/m² | €32,940 | 77% | 11% | 6.9% | 4% | 48 |
| Le Mesnil-le-Roi | 6,340 | €5,440/m² | €36,120 | 68% | 10% | 7.2% | 25% | 46 |
| Le Pecq | 15,858 | €4,700/m² | €30,800 | 69% | 12% | 7.2% | 10% | 284 |
| Le Perray-en-Yvelines | 6,515 | €3,650/m² | €29,640 | 74% | 10% | 6.6% | 9% | 20 |
| Le Port-Marly | 5,583 | €4,570/m² | €26,620 | 43% | 6% | 11.9% | 17% | 230 |
| Le Vésinet | 15,712 | €6,710/m² | €42,870 | 70% | 10% | 7.0% | 10% | 183 |
| Les Clayes-sous-Bois | 16,940 | €3,500/m² | €26,060 | 64% | 8% | 8.8% | 23% | 100 |
| Les Essarts-le-Roi | 6,772 | €3,370/m² | €29,600 | 71% | 8% | 8.3% | 31% | 4 |
| Les Mureaux | 34,151 | €2,470/m² | €18,240 | 42% | 7% | 18.4% | 21% | 63 |
| Limay | 17,584 | €2,560/m² | €20,170 | 48% | 6% | 14.8% | 18% | 61 |
| Limetz-Villez | 2,067 | €2,470/m² | €25,330 | 82% | 7% | 9.0% | 27% | 13 |
| Louveciennes | 7,744 | €4,580/m² | €36,060 | 61% | 14% | 7.6% | 45% | 106 |
| Magnanville | 6,389 | €2,780/m² | €24,580 | 71% | 12% | 13.9% | 19% | 53 |
| Magny-les-Hameaux | 9,353 | €3,560/m² | €28,610 | 61% | 6% | 8.9% | 16% | 29 |
| Maisons-Laffitte | 22,855 | €6,130/m² | €36,990 | 58% | 11% | 6.8% | 41% | 118 |
| Mantes-la-Jolie | 44,246 | €2,730/m² | €17,310 | 31% | 7% | 18.8% | 12% | 128 |
| Mantes-la-Ville | 21,874 | €2,680/m² | €20,040 | 46% | 7% | 17.2% | 9% | 68 |
| Mareil-Marly | 3,984 | €5,670/m² | €40,010 | 79% | 8% | 6.8% | 16% | 61 |
| Marly-le-Roi | 16,619 | €3,980/m² | €31,270 | 69% | 11% | 8.3% | 16% | 174 |
| Maule | 6,100 | €3,590/m² | €29,730 | 73% | 9% | 8.7% | 4% | 19 |
| Maurecourt | 4,399 | €3,850/m² | €29,740 | 68% | 7% | 9.2% | 15% | 60 |
| Maurepas | 19,960 | €3,130/m² | €26,870 | 60% | 10% | 9.5% | 13% | 128 |
| Meulan-en-Yvelines | 8,996 | €2,710/m² | €21,470 | 45% | 8% | 13.4% | 19% | 95 |
| Montesson | 14,606 | €4,850/m² | €32,980 | 66% | 8% | 7.6% | 8% | 101 |
| Montfort-l'Amaury | 2,790 | €4,420/m² | €34,200 | 68% | 20% | 7.5% | 25% | 70 |
| Montigny-le-Bretonneux | 32,150 | €4,070/m² | €30,360 | 56% | 5% | 7.7% | 21% | 175 |
| Morainvilliers | 3,102 | €4,110/m² | €36,400 | 81% | 7% | 7.5% | 49% | 17 |
| Mézières-sur-Seine | 3,874 | €3,180/m² | €27,410 | 74% | 6% | 6.6% | 17% | 17 |
| Mézy-sur-Seine | 2,261 | €2,990/m² | €28,830 | 75% | 10% | 8.5% | 12% | 13 |
| Neauphle-le-Château | 3,295 | €3,790/m² | €31,940 | 72% | 8% | 5.3% | 28% | 52 |
| Noisy-le-Roi | 7,597 | €5,370/m² | €37,660 | 73% | 13% | 8.2% | 12% | 64 |
| Orgerus | 2,484 | €3,290/m² | €29,300 | 88% | 11% | 5.3% | 4% | 34 |
| Orgeval | 7,092 | €4,550/m² | €37,140 | 79% | 8% | 7.8% | 22% | 55 |
| Plaisir | 31,971 | €3,320/m² | €25,690 | 56% | 7% | 11.0% | 13% | 92 |
| Poissy | 40,792 | €4,000/m² | €23,910 | 42% | 9% | 12.4% | 26% | 144 |
| Porcheville | 3,167 | €2,810/m² | €24,860 | 77% | 7% | 13.5% | 2% | 20 |
| Rambouillet | 27,145 | €3,940/m² | €27,990 | 53% | 11% | 8.4% | 22% | 85 |
| Rosny-sur-Seine | 7,041 | €2,600/m² | €22,430 | 68% | 6% | 14.5% | 2% | 44 |
| Saint-Arnoult-en-Yvelines | 5,854 | €3,030/m² | €29,630 | 74% | 9% | 7.4% | 63% | 30 |
| Saint-Cyr-l'École | 20,451 | €4,810/m² | €26,750 | 44% | 5% | 8.8% | 23% | 197 |
| Saint-Germain-en-Laye | 45,286 | €6,660/m² | €33,250 | 48% | 10% | 9.3% | 13% | 234 |
| Saint-Nom-la-Bretèche | 4,877 | €5,040/m² | €44,020 | 89% | 12% | 8.3% | 27% | 31 |
| Saint-Rémy-lès-Chevreuse | 7,747 | €4,540/m² | €34,800 | 74% | 14% | 7.1% | 70% | 40 |
| Sartrouville | 51,570 | €4,440/m² | €25,680 | 58% | 7% | 10.5% | 7% | 131 |
| Septeuil | 2,234 | €2,790/m² | €27,600 | 78% | 11% | 5.3% | 14% | 32 |
| Trappes | 34,276 | €2,960/m² | €18,320 | 33% | 4% | 15.7% | 18% | 103 |
| Triel-sur-Seine | 12,386 | €3,530/m² | €29,350 | 69% | 7% | 7.5% | 1% | 73 |
| Vaux-sur-Seine | 5,143 | €3,240/m² | €29,160 | 73% | 7% | 9.3% | 3% | 22 |
| Verneuil-sur-Seine | 16,112 | €3,700/m² | €28,180 | 57% | 8% | 9.8% | 39% | 45 |
| Vernouillet | 9,953 | €3,930/m² | €28,980 | 63% | 6% | 11.6% | 14% | 37 |
| Versailles | 83,918 | €6,970/m² | €33,780 | 43% | 10% | 7.9% | 25% | 318 |
| Villennes-sur-Seine | 5,792 | €4,680/m² | €38,200 | 67% | 9% | 8.5% | 14% | 83 |
| Villepreux | 11,568 | €4,040/m² | €29,190 | 75% | 7% | 6.6% | 25% | 87 |
| Villiers-Saint-Frédéric | 3,231 | €3,820/m² | €31,450 | 78% | 7% | 5.4% | 40% | 43 |
| Viroflay | 16,943 | €5,960/m² | €36,100 | 64% | 9% | 6.7% | 19% | 204 |
| Voisins-le-Bretonneux | 10,740 | €4,660/m² | €35,470 | 68% | 7% | 6.1% | 19% | 131 |
| Vélizy-Villacoublay | 22,481 | €4,480/m² | €28,610 | 43% | 9% | 6.5% | 36% | 84 |
| Élancourt | 26,348 | €3,060/m² | €26,320 | 64% | 6% | 9.1% | 21% | 100 |
| Épône | 6,778 | €3,280/m² | €26,330 | 64% | 9% | 9.4% | 11% | 27 |
Sources: Insee, 2022 population census (sub-municipal files, Open Licence 2.0) · DGFiP property sales (DVF), data.gouv.fr statistics (Open Licence 2.0) · Insee, Filosofi 2021 income data (Open Licence 2.0) · © OpenStreetMap contributors (ODbL)
People.
1,470,778 residents and 611,871 households at the 2022 census, next to the département figure.
Source: Insee, 2022 population census (sub-municipal files, Open Licence 2.0)
Homes.
669,740 homes, 91% of them main residences, with 4.0 rooms on average.
When main homes were built
Source: Insee, 2022 population census (sub-municipal files, Open Licence 2.0)
Property prices.
84,294 house and flat sales over five years.
Median prices from sales published in France’s Demandes de valeurs foncières (DVF) over ten half-years, for sales of a single property. Individual sales are not shown. A median is only given where there were at least ten sales.
Source: DGFiP property sales (DVF), data.gouv.fr statistics (Open Licence 2.0)
Income and work.
Work and qualifications at the 2022 census.
Sources: Insee, 2022 population census (sub-municipal files, Open Licence 2.0)
Health, shops and services.
Facilities and services in Yvelines on 1 January 2025, from Insee’s permanent database of facilities.
Insee’s permanent database of facilities lists the shops, services and health professionals present in each commune on 1 January. Health professionals in private practice are counted one by one; several may work at the same address.
Source: Insee, permanent database of facilities 2025 (Open Licence 2.0)
Natural and industrial hazards.
Share of the département’s 259 communes exposed to each major hazard, and natural-disaster declarations since 1982.
Natural-disaster declarations by type
A natural-disaster declaration (arrêté CatNat) lets insurers pay out for the damage. The count reflects past events, not a forecast of future risk. The list of hazards comes from each département’s major-risk file; a prevention plan in force limits building in exposed zones.
Source: Géorisques, GASPAR database (Open Licence 2.0), as of 5 October 2026
Every commune.
Every commune has its own page.