Bouches-du-Rhône
Bouches-du-Rhône has 2,069,811 residents in 119 communes. Over five years, homes sold for a median €3,560/m², from €1,840/m² in Tarascon to €7,400/m² in Cassis among communes of more than 2,000 people. 51% of households own their main home.
Four maps of Bouches-du-Rhône.
Each commune is coloured by its value; every map uses the same colour scale, from lowest to highest. Grey: not published.
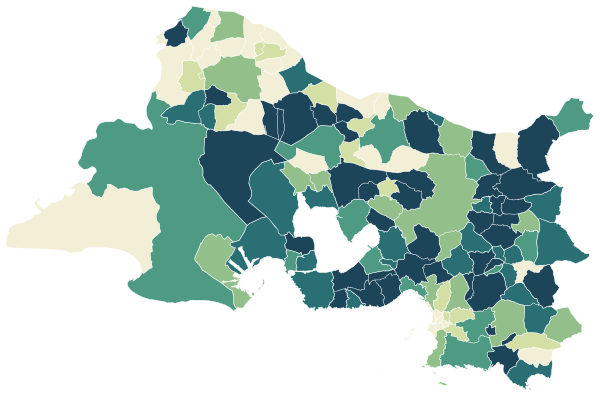
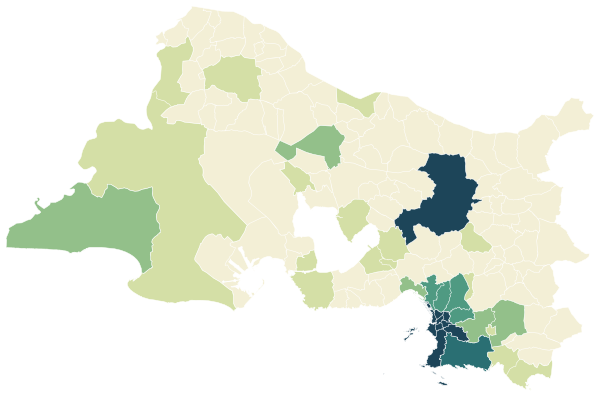
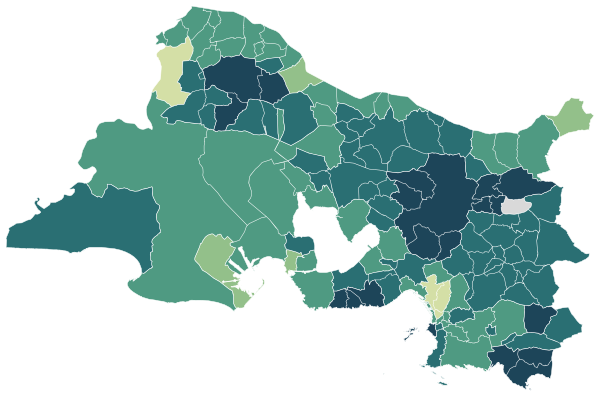
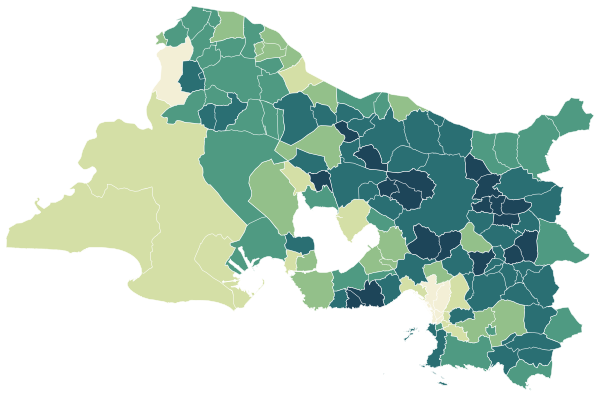
Sources: IGN and Insee, IRIS boundaries and Admin Express 2024 (Open Licence 2.0) · DGFiP property sales (DVF), data.gouv.fr statistics (Open Licence 2.0) · Insee, Filosofi 2021 income data (Open Licence 2.0) · © OpenStreetMap contributors (ODbL)
The 101 communes with more than 2,000 people.
Colour shows where each commune sits among the others in the table, from lowest to highest.
| Commune | Residents | Price per m² | Living standard | Home owners | Aged 75+ | Unemployment | Green 500 m | Services 15 min |
|---|---|---|---|---|---|---|---|---|
| Aix-en-Provence | 147,933 | €5,000/m² | €25,810 | 39% | 10% | 11.6% | 13% | 241 |
| Allauch | 21,404 | €4,490/m² | €27,620 | 75% | 12% | 7.7% | 37% | 47 |
| Alleins | 2,833 | €3,620/m² | €26,040 | 72% | 7% | 8.2% | 34% | 26 |
| Arles | 51,156 | €2,790/m² | €20,060 | 52% | 11% | 12.5% | 16% | 98 |
| Aubagne | 47,724 | €3,080/m² | €22,550 | 49% | 12% | 13.1% | 14% | 100 |
| Auriol | 12,986 | €4,120/m² | €26,260 | 66% | 9% | 9.0% | 47% | 9 |
| Barbentane | 4,262 | €2,920/m² | €24,120 | 65% | 12% | 11.1% | 15% | 27 |
| Berre-l'Étang | 13,941 | €2,900/m² | €20,370 | 47% | 9% | 14.6% | 16% | 62 |
| Bouc-Bel-Air | 15,367 | €5,190/m² | €30,840 | 70% | 13% | 7.5% | 15% | 33 |
| Cabannes | 4,576 | €2,850/m² | €21,650 | 64% | 10% | 12.0% | 0% | 19 |
| Cabriès | 10,143 | €5,170/m² | €32,780 | 77% | 9% | 7.6% | 50% | 9 |
| Cadolive | 2,219 | €4,120/m² | €26,530 | 75% | 9% | 7.2% | 15% | 47 |
| Carnoux-en-Provence | 6,872 | €4,010/m² | €26,380 | 64% | 13% | 9.8% | 33% | 29 |
| Carry-le-Rouet | 5,717 | €5,940/m² | €32,780 | 72% | 16% | 9.2% | 28% | 51 |
| Cassis | 6,706 | €7,400/m² | €28,740 | 57% | 19% | 11.3% | 47% | 78 |
| Ceyreste | 4,847 | €5,210/m² | €28,010 | 72% | 12% | 8.8% | 5% | 43 |
| Charleval | 2,634 | €3,360/m² | €23,340 | 69% | 13% | 8.1% | 0% | 37 |
| Châteauneuf-le-Rouge | 2,331 | €4,890/m² | €31,590 | 73% | 11% | 8.3% | 39% | 21 |
| Châteauneuf-les-Martigues | 18,364 | €3,840/m² | €23,570 | 58% | 9% | 11.8% | 48% | 15 |
| Châteaurenard | 16,668 | €2,800/m² | €21,440 | 53% | 11% | 11.5% | 10% | 32 |
| Coudoux | 3,775 | €4,480/m² | €29,730 | 77% | 9% | 5.0% | 9% | 29 |
| Cuges-les-Pins | 5,949 | €4,080/m² | €25,090 | 62% | 6% | 8.5% | 10% | 23 |
| Ensuès-la-Redonne | 5,796 | €5,380/m² | €29,210 | 74% | 9% | 7.7% | 48% | 26 |
| Eyguières | 6,915 | €3,860/m² | €25,680 | 67% | 8% | 9.9% | 36% | 1 |
| Eyragues | 4,289 | €3,590/m² | €23,990 | 66% | 13% | 8.5% | 2% | 35 |
| Fontvieille | 3,555 | €3,980/m² | €24,530 | 66% | 17% | 10.7% | 22% | 59 |
| Fos-sur-Mer | 15,694 | €3,170/m² | €23,680 | 63% | 8% | 11.0% | 25% | 40 |
| Fuveau | 10,235 | €4,500/m² | €28,140 | 74% | 7% | 7.3% | 53% | 15 |
| Gardanne | 21,534 | €3,750/m² | €22,780 | 51% | 9% | 10.2% | 25% | 65 |
| Gignac-la-Nerthe | 10,030 | €3,880/m² | €24,490 | 69% | 7% | 12.0% | 33% | 24 |
| Grans | 5,382 | €3,820/m² | €26,790 | 66% | 11% | 7.6% | 3% | 24 |
| Graveson | 4,743 | €3,250/m² | €23,070 | 62% | 8% | 9.2% | 3% | 26 |
| Gréasque | 4,469 | €4,460/m² | €26,900 | 66% | 12% | 9.1% | 23% | 44 |
| Gémenos | 6,678 | €5,300/m² | €28,710 | 71% | 16% | 6.7% | 24% | 33 |
| Istres | 44,044 | €3,130/m² | €22,710 | 51% | 8% | 11.0% | 23% | 45 |
| Jouques | 4,478 | €3,490/m² | €25,220 | 68% | 11% | 8.9% | 50% | 28 |
| La Bouilladisse | 6,447 | €4,450/m² | €27,220 | 76% | 11% | 7.7% | 2% | 31 |
| La Ciotat | 37,599 | €5,290/m² | €23,580 | 51% | 14% | 11.6% | 23% | 77 |
| La Destrousse | 4,023 | €4,130/m² | €26,120 | 67% | 12% | 7.9% | 2% | 21 |
| La Fare-les-Oliviers | 8,953 | €4,010/m² | €26,620 | 66% | 10% | 7.4% | 58% | 8 |
| La Penne-sur-Huveaune | 6,618 | €3,960/m² | €24,300 | 58% | 12% | 9.1% | 32% | 62 |
| La Roque-d'Anthéron | 5,355 | €3,160/m² | €22,940 | 54% | 12% | 11.3% | 11% | 49 |
| Lamanon | 2,069 | €3,530/m² | €26,340 | 78% | 12% | 6.9% | 42% | 20 |
| Lambesc | 9,951 | €3,920/m² | €26,100 | 62% | 10% | 10.3% | 21% | 55 |
| Lançon-Provence | 9,627 | €3,900/m² | €26,720 | 71% | 7% | 7.2% | 37% | 16 |
| Le Puy-Sainte-Réparade | 5,794 | €4,240/m² | €26,760 | 65% | 12% | 8.3% | 10% | 19 |
| Le Rove | 5,205 | €4,410/m² | €25,810 | 67% | 10% | 8.0% | 55% | 23 |
| Le Tholonet | 2,370 | €5,290/m² | €32,930 | 67% | 11% | 7.5% | 25% | 16 |
| Les Pennes-Mirabeau | 22,423 | €3,960/m² | €26,320 | 73% | 12% | 7.7% | 34% | 39 |
| Maillane | 2,779 | €3,520/m² | €24,450 | 62% | 9% | 9.5% | 0% | 27 |
| Mallemort | 6,190 | €3,540/m² | €24,230 | 65% | 10% | 11.7% | 5% | 73 |
| Marignane | 33,164 | €2,810/m² | €21,690 | 59% | 10% | 11.5% | 21% | 82 |
| Marseille | 877,215 | €3,230/m² | €20,600 | 43% | 10% | 14.0% | 10% | 369 |
| Martigues | 48,818 | €3,210/m² | €22,570 | 47% | 11% | 13.0% | 27% | 98 |
| Maussane-les-Alpilles | 2,396 | €5,160/m² | €26,190 | 60% | 16% | 11.2% | 6% | 48 |
| Meyrargues | 3,818 | €3,400/m² | €25,340 | 60% | 8% | 7.9% | 36% | 32 |
| Meyreuil | 6,341 | €4,690/m² | €27,130 | 64% | 7% | 5.6% | 41% | 7 |
| Mimet | 4,147 | €4,720/m² | €29,340 | 81% | 12% | 9.0% | 59% | 16 |
| Miramas | 25,891 | €2,700/m² | €19,810 | 47% | 10% | 13.8% | 13% | 98 |
| Mollégès | 2,651 | €3,840/m² | €24,800 | 70% | 11% | 7.9% | 0% | 23 |
| Mouriès | 3,471 | €3,640/m² | €24,110 | 69% | 11% | 8.2% | 3% | 39 |
| Noves | 5,918 | €3,060/m² | €23,320 | 61% | 10% | 11.1% | 1% | 24 |
| Orgon | 2,662 | €2,700/m² | €20,490 | 66% | 11% | 11.6% | 24% | 33 |
| Paradou | 2,181 | €4,540/m² | €27,350 | 81% | 10% | 6.1% | 26% | 31 |
| Peynier | 3,692 | €4,250/m² | €29,250 | 74% | 8% | 8.3% | 17% | 34 |
| Peypin | 5,612 | €4,480/m² | €27,300 | 78% | 8% | 9.4% | 25% | 26 |
| Peyrolles-en-Provence | 5,316 | €3,440/m² | €23,830 | 66% | 8% | 9.9% | 0% | 36 |
| Plan-d'Orgon | 3,562 | €3,080/m² | €22,810 | 73% | 10% | 8.7% | 0% | 26 |
| Plan-de-Cuques | 11,504 | €4,270/m² | €26,120 | 68% | 18% | 6.8% | 33% | 78 |
| Port-Saint-Louis-du-Rhône | 8,510 | €2,430/m² | €20,700 | 42% | 11% | 14.0% | 11% | 30 |
| Port-de-Bouc | 16,138 | €2,690/m² | €20,030 | 46% | 13% | 16.8% | 16% | 55 |
| Pélissanne | 10,799 | €3,830/m² | €27,170 | 70% | 11% | 8.2% | 6% | 43 |
| Rognac | 12,335 | €3,620/m² | €24,630 | 64% | 9% | 9.4% | 41% | 15 |
| Rognes | 4,640 | €4,510/m² | €28,820 | 71% | 14% | 8.7% | 35% | 24 |
| Rognonas | 4,186 | €3,020/m² | €23,980 | 59% | 14% | 8.9% | 1% | 23 |
| Roquefort-la-Bédoule | 5,784 | €4,490/m² | €27,130 | 70% | 14% | 7.6% | 5% | 24 |
| Roquevaire | 8,823 | €4,050/m² | €26,260 | 66% | 10% | 10.2% | 30% | 10 |
| Rousset | 5,357 | €4,320/m² | €25,650 | 55% | 8% | 11.2% | 12% | 58 |
| Saint-Andiol | 3,369 | €2,810/m² | €22,550 | 61% | 10% | 10.6% | 5% | 28 |
| Saint-Cannat | 5,877 | €4,450/m² | €28,080 | 67% | 12% | 8.8% | 4% | 48 |
| Saint-Chamas | 8,669 | €3,230/m² | €24,610 | 61% | 10% | 9.6% | 26% | 29 |
| Saint-Martin-de-Crau | 13,962 | €3,140/m² | €23,270 | 60% | 12% | 8.6% | 49% | 44 |
| Saint-Mitre-les-Remparts | 5,996 | €3,940/m² | €26,910 | 73% | 13% | 9.2% | 48% | 11 |
| Saint-Rémy-de-Provence | 9,547 | €5,340/m² | €23,250 | 61% | 15% | 9.4% | 15% | 61 |
| Saint-Savournin | 3,449 | €4,460/m² | €27,300 | 75% | 8% | 5.8% | 38% | 23 |
| Saint-Victoret | 6,689 | €3,730/m² | €22,680 | 63% | 10% | 6.2% | 22% | 60 |
| Saint-Étienne-du-Grès | 2,480 | €3,950/m² | €25,960 | 72% | 15% | 7.2% | 6% | 21 |
| Saintes-Maries-de-la-Mer | 2,278 | €4,580/m² | €20,550 | 58% | 17% | 13.5% | 0% | 128 |
| Salon-de-Provence | 44,553 | €3,170/m² | €22,400 | 49% | 11% | 12.4% | 19% | 131 |
| Sausset-les-Pins | 7,556 | €6,450/m² | €28,750 | 70% | 20% | 9.4% | 53% | 24 |
| Septèmes-les-Vallons | 12,018 | €3,350/m² | €22,740 | 65% | 10% | 12.3% | 43% | 56 |
| Simiane-Collongue | 5,823 | €4,850/m² | €28,770 | 71% | 11% | 8.5% | 28% | 29 |
| Sénas | 6,829 | €3,210/m² | €22,230 | 57% | 11% | 13.1% | 8% | 24 |
| Tarascon | 15,525 | €1,840/m² | €18,190 | 51% | 8% | 18.1% | 5% | 72 |
| Trets | 10,933 | €3,880/m² | €25,260 | 60% | 9% | 12.2% | 25% | 55 |
| Velaux | 8,827 | €4,420/m² | €28,760 | 75% | 11% | 6.5% | 11% | 47 |
| Venelles | 8,420 | €4,870/m² | €29,240 | 70% | 12% | 7.0% | 22% | 31 |
| Ventabren | 5,613 | €5,230/m² | €33,710 | 81% | 12% | 8.8% | 48% | 50 |
| Vernègues | 2,158 | €4,020/m² | €25,530 | 82% | 3% | 8.8% | 5% | 6 |
| Vitrolles | 36,612 | €3,460/m² | €22,090 | 57% | 8% | 13.0% | 28% | 69 |
| Éguilles | 8,349 | €5,300/m² | €32,090 | 67% | 11% | 8.1% | 36% | 16 |
Sources: Insee, 2022 population census (sub-municipal files, Open Licence 2.0) · DGFiP property sales (DVF), data.gouv.fr statistics (Open Licence 2.0) · Insee, Filosofi 2021 income data (Open Licence 2.0) · © OpenStreetMap contributors (ODbL)
People.
2,069,811 residents and 948,362 households at the 2022 census, next to the département figure.
Source: Insee, 2022 population census (sub-municipal files, Open Licence 2.0)
Homes.
1,078,388 homes, 88% of them main residences, with 3.5 rooms on average.
When main homes were built
Source: Insee, 2022 population census (sub-municipal files, Open Licence 2.0)
Property prices.
134,009 house and flat sales over five years.
Median prices from sales published in France’s Demandes de valeurs foncières (DVF) over ten half-years, for sales of a single property. Individual sales are not shown. A median is only given where there were at least ten sales.
Source: DGFiP property sales (DVF), data.gouv.fr statistics (Open Licence 2.0)
Income and work.
Work and qualifications at the 2022 census.
Sources: Insee, 2022 population census (sub-municipal files, Open Licence 2.0)
Health, shops and services.
Facilities and services in Bouches-du-Rhône on 1 January 2025, from Insee’s permanent database of facilities.
Insee’s permanent database of facilities lists the shops, services and health professionals present in each commune on 1 January. Health professionals in private practice are counted one by one; several may work at the same address.
Source: Insee, permanent database of facilities 2025 (Open Licence 2.0)
Natural and industrial hazards.
Share of the département’s 119 communes exposed to each major hazard, and natural-disaster declarations since 1982.
Natural-disaster declarations by type
A natural-disaster declaration (arrêté CatNat) lets insurers pay out for the damage. The count reflects past events, not a forecast of future risk. The list of hazards comes from each département’s major-risk file; a prevention plan in force limits building in exposed zones.
Source: Géorisques, GASPAR database (Open Licence 2.0), as of 5 October 2026
Every commune.
Every commune has its own page.