Septèmes-les-Vallons
Septèmes-les-Vallons has 12,018 residents and 5,139 homes, 55% of them houses. Homes sold for a median €3,350/m² over five years, 6% below the département figure. The median living standard is €22,740 a year. For the average resident, 56 everyday shops and services are within a 15-minute walk.
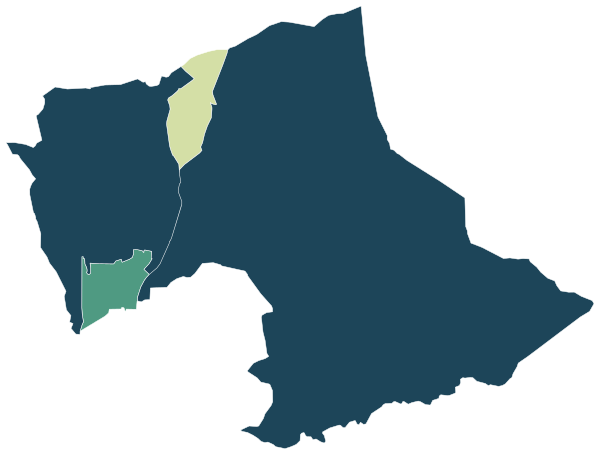
Sources: IGN and Insee, IRIS boundaries and Admin Express 2024 (Open Licence 2.0) · © OpenStreetMap contributors (ODbL) · Insee, Filosofi 2021 income data (Open Licence 2.0)
All 4 IRIS neighbourhoods.
IRIS are Insee’s statistical neighbourhoods of about 2,000 people each. Colour shows where each one sits among the others.
| Neighbourhood | Residents | Living standard | Home owners | Social housing | Aged 75+ | Unemployment | Green 500 m | Services 15 min |
|---|---|---|---|---|---|---|---|---|
| Fabregoules-Caillols-Rougière-Peyrards | 2,781 | €23,910 | 65% | 2% | 11% | 12.0% | 100% | 2 |
| Pré de l'Aube Centre | 3,049 | €23,170 | 70% | 6% | 8% | 7.5% | 9% | 80 |
| Castors-Bedoule | 3,740 | €24,710 | 76% | 1% | 14% | 8.4% | 45% | 58 |
| Notre-Dame | 2,447 | €15,960 | 37% | 52% | 6% | 27.3% | 16% | 83 |
Sources: Insee, 2022 population census (sub-municipal files, Open Licence 2.0) · Insee, Filosofi 2021 income data (Open Licence 2.0) · © OpenStreetMap contributors (ODbL)
People.
12,018 residents and 4,855 households at the 2022 census, next to the département figure.
Source: Insee, 2022 population census (sub-municipal files, Open Licence 2.0)
Homes.
5,139 homes, 95% of them main residences, with 3.8 rooms on average.
When main homes were built
Source: Insee, 2022 population census (sub-municipal files, Open Licence 2.0)
Property prices.
613 house and flat sales over five years.
Median prices from sales published in France’s Demandes de valeurs foncières (DVF) over ten half-years, for sales of a single property. Individual sales are not shown. A median is only given where there were at least ten sales.
Source: DGFiP property sales (DVF), data.gouv.fr statistics (Open Licence 2.0)
Income and work.
Median living standard of €22,740 a year in 2021.
Living standard is a household’s disposable income after taxes and benefits, divided by its consumption units. Half of residents live on less than the median. Income on its own says nothing about what a neighbourhood is like to live in.
Sources: Insee, Filosofi 2021 income data (Open Licence 2.0) · Insee, 2022 population census (sub-municipal files, Open Licence 2.0)
Safety.
Offences recorded in 2025, with the rate per 1,000 residents and the change from 2024.
| Indicator | 2025 | Rate | Change |
|---|---|---|---|
| Burglaries of homes | 52 | 10.1 per 1,000 | +2% |
| Thefts from people without violence | 47 | 3.9 per 1,000 | −6% |
| Physical violence outside the family | 27 | 2.3 per 1,000 | +8% |
| Domestic physical violence | 33 | 2.8 per 1,000 | +22% |
| Vehicle thefts | 55 | 4.6 per 1,000 | −8% |
| Thefts from vehicles | 59 | 4.9 per 1,000 | −17% |
| Thefts of vehicle parts | 50 | 4.2 per 1,000 | +11% |
| Deliberate damage and vandalism | 131 | 10.9 per 1,000 | +18% |
| Fraud and payment card fraud | 80 | 6.7 per 1,000 | +36% |
These figures count offences recorded by the police and gendarmerie, not how safe a place feels, and not every offence is reported. Rates are per 1,000 residents (per 1,000 homes for burglaries): where many people visit but few live, as in town centres and shopping areas, they are naturally higher. Small counts are not published.
Source: Ministry of the Interior (SSMSI), recorded crime by municipality 2024–2025 (Open Licence 2.0)
Everyday life.
What is within one kilometre of the town hall. For the average resident, 16 public transport stops are within 800 m, and the nearest rail or tram station is 1.6 km away.
Source: © OpenStreetMap contributors (ODbL)
Health, shops and services.
Facilities and services in Septèmes-les-Vallons on 1 January 2025, from Insee’s permanent database of facilities.
Insee’s permanent database of facilities lists the shops, services and health professionals present in each commune on 1 January. Health professionals in private practice are counted one by one; several may work at the same address.
Source: Insee, permanent database of facilities 2025 (Open Licence 2.0)
Natural and industrial hazards.
Major hazards the State lists for Septèmes-les-Vallons, prevention plans in force and natural-disaster declarations since 1982.
Natural-disaster declarations by type
A natural-disaster declaration (arrêté CatNat) lets insurers pay out for the damage. The count reflects past events, not a forecast of future risk. The list of hazards comes from each département’s major-risk file; a prevention plan in force limits building in exposed zones.
Source: Géorisques, GASPAR database (Open Licence 2.0), as of 5 October 2026
Schools.
8 primary and nursery schools, 1 collèges and 1 lycées are open here, 9 of them state schools.
Source: Ministry of Education, school directory (Open Licence 2.0). Admission depends on catchment rules and each school’s own policy.
Nearby communes.
The communes in the département whose town halls are closest.