Essonne
Essonne has 1,324,546 residents in 194 communes. Over five years, homes sold for a median €3,310/m², from €1,500/m² in Grigny to €4,950/m² in Bièvres among communes of more than 2,000 people. 58% of households own their main home.
Four maps of Essonne.
Each commune is coloured by its value; every map uses the same colour scale, from lowest to highest. Grey: not published.
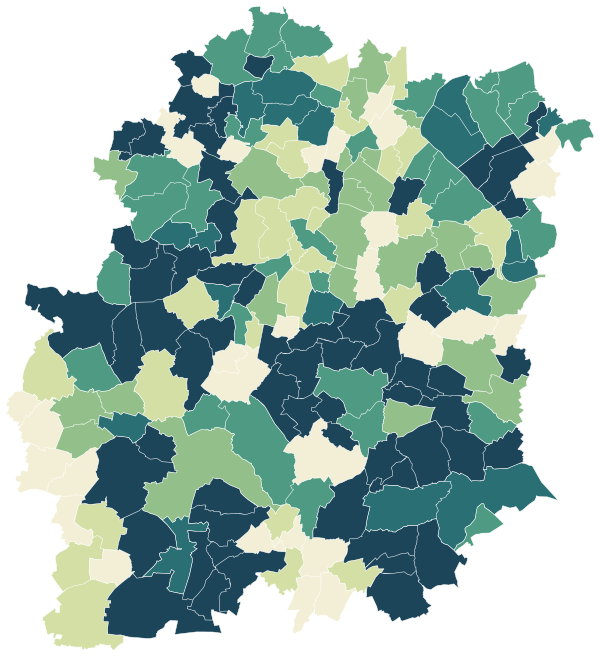
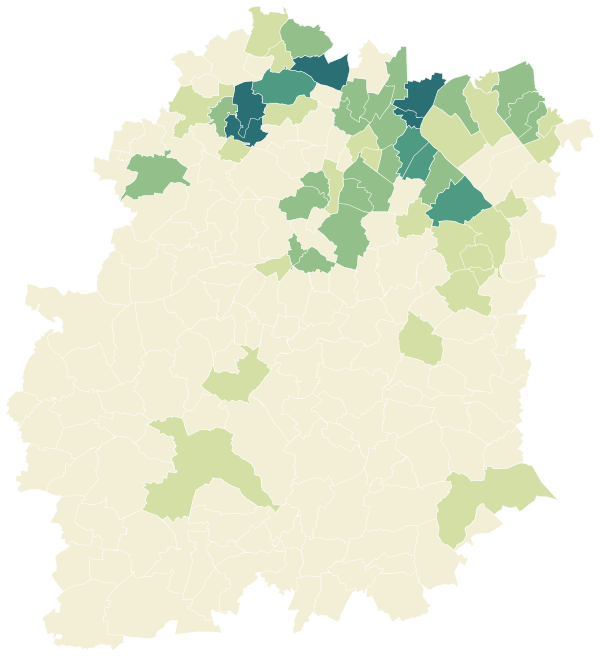
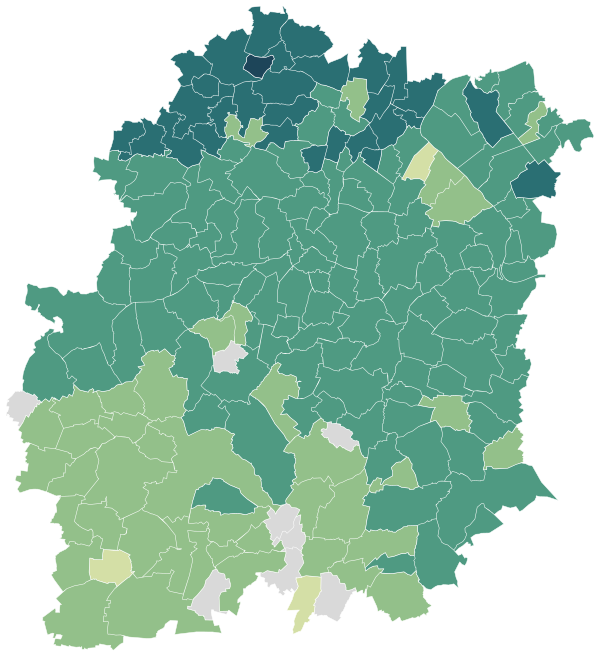
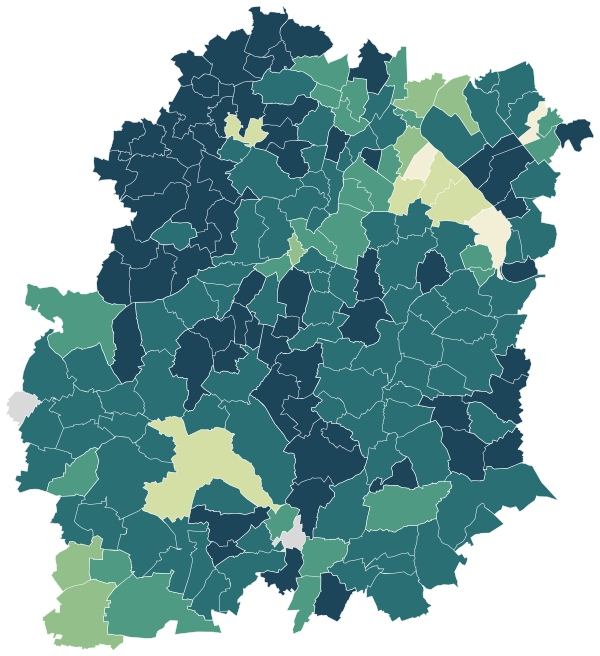
Sources: IGN and Insee, IRIS boundaries and Admin Express 2024 (Open Licence 2.0) · DGFiP property sales (DVF), data.gouv.fr statistics (Open Licence 2.0) · Insee, Filosofi 2021 income data (Open Licence 2.0) · © OpenStreetMap contributors (ODbL)
The 102 communes with more than 2,000 people.
Colour shows where each commune sits among the others in the table, from lowest to highest.
| Commune | Residents | Price per m² | Living standard | Home owners | Aged 75+ | Unemployment | Green 500 m | Services 15 min |
|---|---|---|---|---|---|---|---|---|
| Angerville | 4,416 | €2,200/m² | €22,130 | 67% | 7% | 12.5% | 7% | 29 |
| Arpajon | 11,503 | €3,480/m² | €21,980 | 41% | 9% | 11.5% | 6% | 134 |
| Athis-Mons | 36,451 | €3,630/m² | €22,380 | 44% | 6% | 8.8% | 16% | 200 |
| Ballainvilliers | 4,838 | €3,850/m² | €29,750 | 68% | 9% | 6.5% | 4% | 34 |
| Ballancourt-sur-Essonne | 7,795 | €3,200/m² | €25,500 | 65% | 10% | 9.0% | 2% | 72 |
| Bièvres | 4,700 | €4,950/m² | €34,800 | 68% | 8% | 6.4% | 18% | 60 |
| Boissy-sous-Saint-Yon | 3,855 | €3,190/m² | €27,770 | 78% | 8% | 5.2% | 11% | 31 |
| Bondoufle | 10,833 | €3,270/m² | €26,390 | 73% | 7% | 7.8% | 8% | 74 |
| Bouray-sur-Juine | 2,077 | €3,040/m² | €28,910 | 79% | 8% | 7.6% | 32% | 26 |
| Boussy-Saint-Antoine | 7,986 | €2,870/m² | €24,320 | 64% | 8% | 11.1% | 28% | 86 |
| Boutigny-sur-Essonne | 3,048 | €2,900/m² | €27,040 | 83% | 10% | 7.7% | 37% | 16 |
| Breuillet | 9,023 | €3,180/m² | €26,570 | 70% | 9% | 8.7% | 36% | 34 |
| Briis-sous-Forges | 3,375 | €3,510/m² | €30,610 | 78% | 11% | 5.5% | 18% | 49 |
| Brunoy | 25,792 | €3,590/m² | €27,460 | 65% | 9% | 8.7% | 19% | 134 |
| Bruyères-le-Châtel | 3,738 | €3,150/m² | €27,530 | 67% | 8% | 7.4% | 9% | 22 |
| Brétigny-sur-Orge | 26,658 | €3,310/m² | €23,680 | 49% | 6% | 10.8% | 13% | 111 |
| Bures-sur-Yvette | 9,481 | €4,270/m² | €33,510 | 71% | 11% | 6.4% | 34% | 111 |
| Cerny | 3,425 | €2,900/m² | €27,350 | 81% | 10% | 6.9% | 18% | 24 |
| Champcueil | 2,873 | €3,050/m² | €27,870 | 83% | 14% | 7.7% | 13% | 19 |
| Champlan | 2,606 | €3,550/m² | €25,020 | 69% | 8% | 10.0% | 21% | 33 |
| Cheptainville | 2,212 | €3,230/m² | €28,720 | 82% | 6% | 5.6% | 24% | 10 |
| Chilly-Mazarin | 19,981 | €2,680/m² | €23,140 | 57% | 7% | 10.3% | 11% | 114 |
| Corbeil-Essonnes | 53,712 | €2,750/m² | €18,970 | 37% | 5% | 11.6% | 7% | 96 |
| Crosne | 9,606 | €3,240/m² | €26,280 | 68% | 6% | 8.9% | 21% | 87 |
| Dourdan | 11,068 | €3,020/m² | €23,670 | 44% | 9% | 10.5% | 54% | 56 |
| Draveil | 29,824 | €3,530/m² | €26,090 | 59% | 10% | 10.4% | 26% | 96 |
| Fleury-Mérogis | 13,816 | €3,090/m² | €19,420 | 28% | 1% | 10.7% | 85% | 45 |
| Fontenay-lès-Briis | 2,322 | €3,260/m² | €29,050 | 83% | 4% | 6.1% | 30% | 15 |
| Forges-les-Bains | 4,138 | €3,290/m² | €30,150 | 81% | 5% | 6.3% | 18% | 23 |
| Gif-sur-Yvette | 22,578 | €4,130/m² | €34,730 | 57% | 10% | 7.9% | 32% | 71 |
| Gometz-le-Châtel | 2,635 | €3,850/m² | €30,690 | 66% | 9% | 6.2% | 36% | 24 |
| Grigny | 26,500 | €1,500/m² | €14,790 | 28% | 4% | 19.1% | 21% | 154 |
| Igny | 10,571 | €4,750/m² | €31,760 | 71% | 9% | 7.4% | 15% | 99 |
| Itteville | 6,674 | €3,220/m² | €28,000 | 84% | 6% | 6.5% | 32% | 18 |
| Juvisy-sur-Orge | 18,978 | €3,690/m² | €23,520 | 41% | 6% | 11.4% | 10% | 206 |
| La Ferté-Alais | 3,663 | €2,910/m² | €26,470 | 66% | 7% | 6.8% | 30% | 40 |
| La Norville | 4,308 | €3,380/m² | €28,720 | 78% | 8% | 6.7% | 7% | 137 |
| La Ville-du-Bois | 8,140 | €3,620/m² | €27,390 | 66% | 6% | 7.8% | 5% | 59 |
| Lardy | 5,572 | €3,150/m² | €28,860 | 79% | 8% | 6.9% | 30% | 31 |
| Le Coudray-Montceaux | 4,738 | €3,000/m² | €26,830 | 63% | 8% | 9.5% | 13% | 39 |
| Le Mérévillois | 3,420 | €2,320/m² | €24,880 | 82% | 10% | 8.0% | 49% | 28 |
| Le Plessis-Pâté | 4,107 | €3,370/m² | €28,860 | 74% | 7% | 7.3% | 3% | 58 |
| Les Ulis | 25,633 | €2,470/m² | €19,950 | 40% | 5% | 13.3% | 18% | 188 |
| Leuville-sur-Orge | 4,307 | €3,240/m² | €27,910 | 80% | 7% | 8.3% | 6% | 31 |
| Limours | 6,408 | €3,530/m² | €30,560 | 73% | 10% | 6.3% | 20% | 103 |
| Linas | 7,310 | €3,410/m² | €26,350 | 72% | 6% | 8.5% | 6% | 103 |
| Lisses | 7,295 | €3,070/m² | €26,150 | 68% | 7% | 8.8% | 13% | 64 |
| Longjumeau | 20,470 | €3,020/m² | €23,320 | 55% | 8% | 10.4% | 5% | 128 |
| Longpont-sur-Orge | 6,456 | €3,320/m² | €28,330 | 76% | 8% | 9.1% | 36% | 93 |
| Maisse | 2,804 | €2,750/m² | €25,060 | 78% | 10% | 8.9% | 28% | 15 |
| Marcoussis | 8,597 | €3,380/m² | €28,880 | 71% | 9% | 7.7% | 15% | 56 |
| Marolles-en-Hurepoix | 5,688 | €3,550/m² | €28,330 | 72% | 9% | 5.9% | 11% | 40 |
| Massy | 50,597 | €4,440/m² | €24,560 | 40% | 6% | 9.7% | 10% | 220 |
| Mennecy | 16,071 | €3,170/m² | €27,390 | 62% | 8% | 9.1% | 24% | 63 |
| Milly-la-Forêt | 4,582 | €3,210/m² | €28,370 | 71% | 14% | 7.6% | 29% | 70 |
| Montgeron | 23,890 | €3,960/m² | €25,500 | 62% | 9% | 9.6% | 21% | 97 |
| Montlhéry | 9,238 | €3,560/m² | €26,310 | 52% | 6% | 8.7% | 14% | 107 |
| Morangis | 13,773 | €3,820/m² | €26,260 | 64% | 9% | 9.9% | 4% | 113 |
| Morigny-Champigny | 4,435 | €2,960/m² | €28,170 | 84% | 11% | 6.7% | 17% | 29 |
| Morsang-sur-Orge | 21,161 | €3,430/m² | €24,900 | 63% | 8% | 12.3% | 8% | 116 |
| Nozay | 4,465 | €3,570/m² | €30,540 | 77% | 6% | 5.9% | 8% | 44 |
| Ollainville | 5,361 | €3,200/m² | €26,790 | 69% | 6% | 6.8% | 8% | 28 |
| Ormoy | 2,896 | €3,530/m² | €25,400 | 63% | 3% | 8.8% | 38% | 69 |
| Orsay | 16,655 | €4,410/m² | €33,200 | 61% | 10% | 7.5% | 28% | 191 |
| Palaiseau | 36,067 | €4,300/m² | €28,570 | 47% | 7% | 9.2% | 28% | 164 |
| Paray-Vieille-Poste | 7,956 | €4,140/m² | €25,300 | 57% | 11% | 9.1% | 9% | 127 |
| Pussay | 2,182 | €2,070/m² | €22,820 | 73% | 10% | 10.4% | 9% | 19 |
| Quincy-sous-Sénart | 9,491 | €3,280/m² | €23,930 | 58% | 10% | 12.7% | 3% | 85 |
| Ris-Orangis | 30,283 | €2,340/m² | €20,090 | 51% | 7% | 12.3% | 15% | 139 |
| Saclay | 4,380 | €4,860/m² | €34,070 | 69% | 8% | 5.9% | 17% | 37 |
| Saint-Chéron | 5,176 | €3,180/m² | €26,980 | 70% | 8% | 7.8% | 9% | 35 |
| Saint-Germain-lès-Arpajon | 11,577 | €3,180/m² | €24,340 | 65% | 5% | 11.0% | 21% | 30 |
| Saint-Germain-lès-Corbeil | 7,471 | €3,360/m² | €29,890 | 77% | 10% | 8.3% | 38% | 71 |
| Saint-Michel-sur-Orge | 21,536 | €2,890/m² | €23,160 | 52% | 8% | 12.4% | 15% | 112 |
| Saint-Pierre-du-Perray | 12,071 | €3,530/m² | €26,200 | 62% | 5% | 8.4% | 20% | 57 |
| Saint-Vrain | 3,046 | €3,260/m² | €29,300 | 80% | 14% | 6.2% | 38% | 18 |
| Sainte-Geneviève-des-Bois | 35,714 | €3,500/m² | €24,370 | 58% | 9% | 10.9% | 13% | 127 |
| Saintry-sur-Seine | 5,853 | €3,200/m² | €27,730 | 80% | 9% | 8.8% | 23% | 51 |
| Saulx-les-Chartreux | 6,611 | €3,590/m² | €27,220 | 68% | 6% | 9.9% | 28% | 45 |
| Savigny-sur-Orge | 37,775 | €3,620/m² | €25,590 | 63% | 8% | 9.7% | 4% | 126 |
| Soisy-sur-Seine | 7,370 | €3,410/m² | €30,670 | 68% | 13% | 8.4% | 39% | 49 |
| Tigery | 4,359 | €3,720/m² | €27,420 | 65% | 2% | 7.1% | 4% | 32 |
| Varennes-Jarcy | 2,381 | €3,530/m² | €33,490 | 76% | 8% | 8.6% | 19% | 42 |
| Verrières-le-Buisson | 14,772 | €4,930/m² | €36,270 | 72% | 13% | 8.0% | 20% | 137 |
| Vert-le-Grand | 2,348 | €3,320/m² | €28,960 | 71% | 7% | 5.6% | 12% | 30 |
| Vert-le-Petit | 2,716 | €3,080/m² | €27,040 | 69% | 5% | 8.1% | 9% | 30 |
| Vigneux-sur-Seine | 31,233 | €3,500/m² | €21,390 | 47% | 6% | 13.3% | 27% | 107 |
| Villabé | 5,654 | €3,390/m² | €25,350 | 66% | 6% | 9.6% | 12% | 70 |
| Villebon-sur-Yvette | 10,353 | €3,740/m² | €29,190 | 62% | 9% | 8.3% | 29% | 67 |
| Villejust | 2,502 | €3,790/m² | €29,140 | 73% | 4% | 6.5% | 5% | 22 |
| Villemoisson-sur-Orge | 7,226 | €3,800/m² | €30,300 | 73% | 9% | 7.0% | 12% | 69 |
| Villiers-sur-Orge | 4,576 | €3,380/m² | €28,900 | 72% | 8% | 7.1% | 10% | 48 |
| Viry-Châtillon | 31,112 | €3,100/m² | €21,860 | 51% | 8% | 14.0% | 10% | 142 |
| Wissous | 6,924 | €4,430/m² | €29,510 | 68% | 6% | 7.4% | 14% | 58 |
| Yerres | 28,349 | €3,570/m² | €28,170 | 72% | 9% | 9.3% | 21% | 104 |
| Égly | 7,078 | €3,250/m² | €23,770 | 55% | 6% | 11.9% | 19% | 63 |
| Épinay-sous-Sénart | 11,783 | €2,080/m² | €18,880 | 47% | 6% | 17.5% | 43% | 107 |
| Épinay-sur-Orge | 10,626 | €3,960/m² | €28,730 | 67% | 11% | 8.7% | 22% | 69 |
| Étampes | 26,601 | €2,480/m² | €20,480 | 44% | 6% | 13.5% | 14% | 77 |
| Étiolles | 3,100 | €3,420/m² | €33,550 | 71% | 11% | 7.8% | 30% | 38 |
| Étréchy | 6,926 | €3,170/m² | €27,380 | 72% | 12% | 6.7% | 2% | 74 |
| Évry-Courcouronnes | 66,700 | €2,440/m² | €19,160 | 38% | 5% | 16.6% | 17% | 176 |
Sources: Insee, 2022 population census (sub-municipal files, Open Licence 2.0) · DGFiP property sales (DVF), data.gouv.fr statistics (Open Licence 2.0) · Insee, Filosofi 2021 income data (Open Licence 2.0) · © OpenStreetMap contributors (ODbL)
People.
1,324,546 residents and 542,853 households at the 2022 census, next to the département figure.
Source: Insee, 2022 population census (sub-municipal files, Open Licence 2.0)
Homes.
593,093 homes, 91% of them main residences, with 3.9 rooms on average.
When main homes were built
Source: Insee, 2022 population census (sub-municipal files, Open Licence 2.0)
Property prices.
74,522 house and flat sales over five years.
Median prices from sales published in France’s Demandes de valeurs foncières (DVF) over ten half-years, for sales of a single property. Individual sales are not shown. A median is only given where there were at least ten sales.
Source: DGFiP property sales (DVF), data.gouv.fr statistics (Open Licence 2.0)
Income and work.
Work and qualifications at the 2022 census.
Sources: Insee, 2022 population census (sub-municipal files, Open Licence 2.0)
Health, shops and services.
Facilities and services in Essonne on 1 January 2025, from Insee’s permanent database of facilities.
Insee’s permanent database of facilities lists the shops, services and health professionals present in each commune on 1 January. Health professionals in private practice are counted one by one; several may work at the same address.
Source: Insee, permanent database of facilities 2025 (Open Licence 2.0)
Natural and industrial hazards.
Share of the département’s 194 communes exposed to each major hazard, and natural-disaster declarations since 1982.
Natural-disaster declarations by type
A natural-disaster declaration (arrêté CatNat) lets insurers pay out for the damage. The count reflects past events, not a forecast of future risk. The list of hazards comes from each département’s major-risk file; a prevention plan in force limits building in exposed zones.
Source: Géorisques, GASPAR database (Open Licence 2.0), as of 5 October 2026
Every commune.
Every commune has its own page.