Gironde
Gironde has 1,674,980 residents in 535 communes. Over five years, homes sold for a median €3,520/m², from €880/m² in Sainte-Foy-la-Grande to €10,670/m² in Lège-Cap-Ferret among communes of more than 2,000 people. 55% of households own their main home.
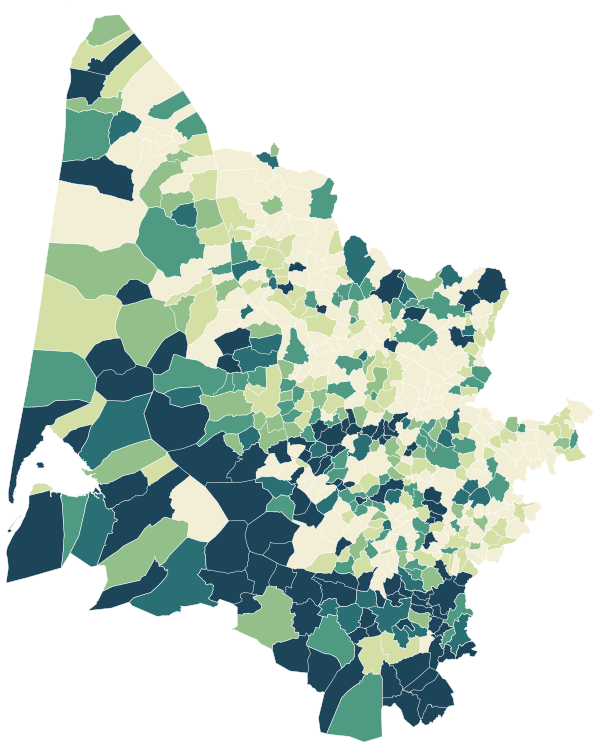
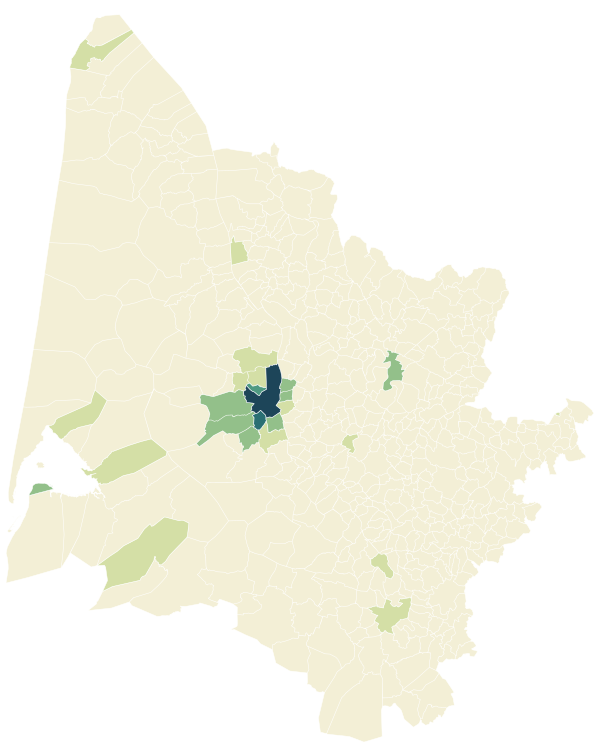
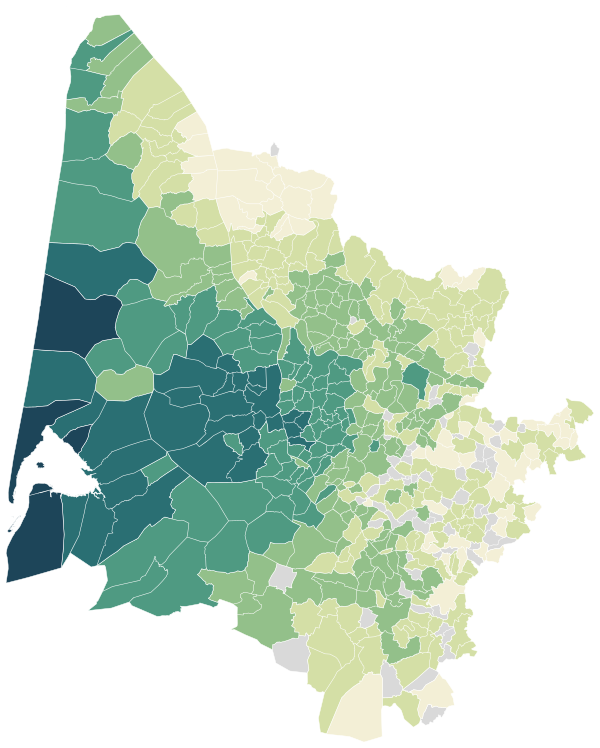
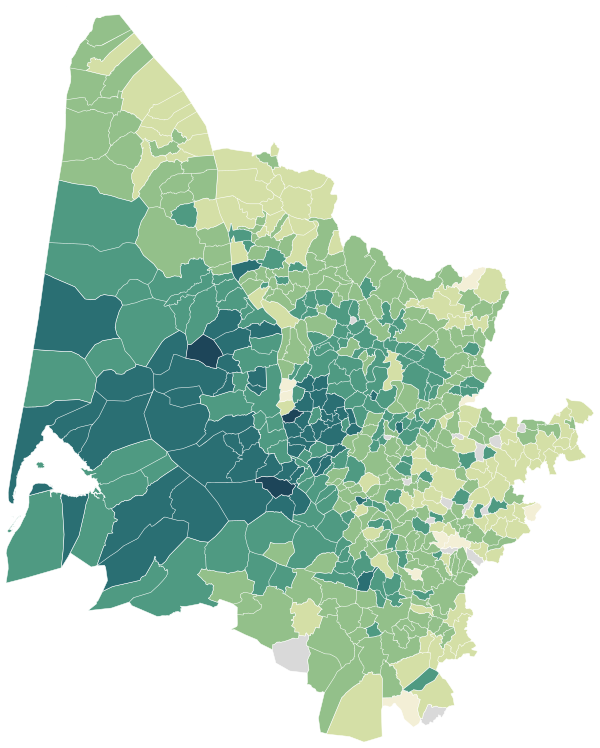
Four maps of Gironde.
Each commune is coloured by its value; every map uses the same colour scale, from lowest to highest. Grey: not published.
Sources: IGN and Insee, IRIS boundaries and Admin Express 2024 (Open Licence 2.0) · DGFiP property sales (DVF), data.gouv.fr statistics (Open Licence 2.0) · Insee, Filosofi 2021 income data (Open Licence 2.0) · © OpenStreetMap contributors (ODbL)
The 141 communes with more than 2,000 people.
Colour shows where each commune sits among the others in the table, from lowest to highest.
| Commune | Residents | Price per m² | Living standard | Home owners | Aged 75+ | Unemployment | Green 500 m | Services 15 min |
|---|---|---|---|---|---|---|---|---|
| Abzac | 2,030 | €1,630/m² | €21,060 | 64% | 9% | 12.3% | 0% | 17 |
| Ambarès-et-Lagrave | 17,298 | €2,810/m² | €21,780 | 60% | 7% | 12.7% | 17% | 18 |
| Ambès | 3,291 | €1,960/m² | €20,490 | 56% | 8% | 11.5% | 2% | 26 |
| Andernos-les-Bains | 12,614 | €5,280/m² | €27,410 | 74% | 21% | 10.4% | 43% | 29 |
| Arcachon | 10,895 | €7,890/m² | €27,150 | 61% | 30% | 16.0% | 6% | 111 |
| Arsac | 4,040 | €3,180/m² | €27,250 | 89% | 9% | 5.4% | 4% | 29 |
| Artigues-près-Bordeaux | 8,623 | €3,220/m² | €24,380 | 58% | 6% | 10.5% | 18% | 47 |
| Arveyres | 2,058 | €2,460/m² | €24,500 | 73% | 9% | 7.6% | 13% | 14 |
| Arès | 6,477 | €4,770/m² | €25,530 | 68% | 20% | 11.3% | 6% | 63 |
| Audenge | 9,550 | €3,780/m² | €24,210 | 60% | 10% | 11.5% | 12% | 66 |
| Avensan | 3,108 | €2,940/m² | €24,460 | 87% | 7% | 5.6% | 5% | 9 |
| Barsac | 2,061 | €1,840/m² | €22,190 | 73% | 9% | 5.5% | 0% | 15 |
| Bassens | 8,132 | €2,990/m² | €21,280 | 41% | 9% | 13.0% | 12% | 50 |
| Bazas | 4,819 | €2,030/m² | €21,110 | 53% | 17% | 12.0% | 25% | 72 |
| Beautiran | 2,466 | €3,050/m² | €25,130 | 82% | 7% | 6.8% | 2% | 25 |
| Belin-Béliet | 6,205 | €2,890/m² | €23,710 | 70% | 8% | 10.2% | 27% | 33 |
| Beychac-et-Caillau | 2,608 | €2,960/m² | €25,370 | 84% | 8% | 6.3% | 21% | 7 |
| Biganos | 11,303 | €3,650/m² | €24,400 | 68% | 10% | 8.7% | 50% | 33 |
| Blanquefort | 16,786 | €3,500/m² | €24,700 | 56% | 8% | 10.3% | 25% | 71 |
| Blaye | 5,017 | €1,620/m² | €19,750 | 39% | 13% | 16.8% | 20% | 77 |
| Bordeaux | 265,328 | €4,540/m² | €24,870 | 33% | 8% | 12.1% | 6% | 438 |
| Bouliac | 3,806 | €4,040/m² | €30,540 | 64% | 10% | 5.5% | 15% | 28 |
| Bourg | 2,264 | €1,700/m² | €21,100 | 58% | 11% | 13.6% | 8% | 28 |
| Bruges | 20,382 | €3,740/m² | €25,550 | 46% | 6% | 8.0% | 16% | 74 |
| Bègles | 30,968 | €3,700/m² | €23,360 | 46% | 8% | 11.4% | 13% | 129 |
| Cabanac-et-Villagrains | 2,400 | €2,800/m² | €25,450 | 80% | 4% | 6.0% | 37% | 9 |
| Cadaujac | 6,784 | €3,350/m² | €24,250 | 61% | 8% | 8.2% | 40% | 24 |
| Cadillac-sur-Garonne | 2,727 | €2,190/m² | €20,240 | 42% | 8% | 10.5% | 19% | 54 |
| Camblanes-et-Meynac | 3,145 | €3,650/m² | €28,180 | 81% | 9% | 5.4% | 39% | 37 |
| Canéjan | 5,836 | €3,570/m² | €26,100 | 59% | 10% | 7.5% | 15% | 42 |
| Carbon-Blanc | 8,342 | €2,910/m² | €23,210 | 62% | 11% | 12.3% | 4% | 51 |
| Carcans | 2,415 | €3,950/m² | €23,810 | 75% | 11% | 11.3% | 13% | 27 |
| Carignan-de-Bordeaux | 4,312 | €3,600/m² | €27,950 | 72% | 11% | 7.0% | 7% | 14 |
| Castelnau-de-Médoc | 4,850 | €2,800/m² | €23,530 | 66% | 9% | 10.1% | 12% | 37 |
| Castillon-la-Bataille | 3,320 | €1,230/m² | €15,750 | 39% | 16% | 18.8% | 0% | 58 |
| Castres-Gironde | 2,689 | €2,950/m² | €24,940 | 74% | 5% | 7.0% | 4% | 25 |
| Cavignac | 2,368 | €1,950/m² | €21,270 | 61% | 8% | 11.3% | 5% | 21 |
| Cenon | 26,784 | €3,250/m² | €18,920 | 32% | 8% | 15.0% | 15% | 131 |
| Cestas | 16,757 | €3,880/m² | €28,830 | 76% | 13% | 6.4% | 41% | 50 |
| Cissac-Médoc | 2,310 | €2,140/m² | €22,790 | 81% | 7% | 12.2% | 10% | 8 |
| Coutras | 8,695 | €1,790/m² | €20,730 | 58% | 13% | 15.4% | 19% | 6 |
| Créon | 4,863 | €2,780/m² | €22,410 | 56% | 11% | 10.1% | 0% | 65 |
| Cubzac-les-Ponts | 2,637 | €2,360/m² | €23,010 | 78% | 7% | 8.4% | 1% | 11 |
| Cussac-Fort-Médoc | 2,326 | €2,180/m² | €21,490 | 80% | 6% | 9.7% | 0% | 8 |
| Cénac | 2,151 | €3,320/m² | €28,590 | 86% | 7% | 7.8% | 16% | 26 |
| Cérons | 2,131 | €2,330/m² | €23,240 | 69% | 8% | 7.9% | 7% | 14 |
| Cézac | 2,740 | €2,190/m² | €22,510 | 83% | 5% | 11.5% | 0% | 6 |
| Eysines | 24,436 | €3,620/m² | €23,980 | 49% | 9% | 10.6% | 21% | 87 |
| Fargues-Saint-Hilaire | 3,504 | €3,290/m² | €25,170 | 62% | 11% | 7.2% | 16% | 46 |
| Floirac | 17,939 | €3,320/m² | €20,850 | 47% | 8% | 12.0% | 21% | 84 |
| Gaillan-en-Médoc | 2,376 | €2,260/m² | €21,910 | 76% | 12% | 15.1% | 4% | 8 |
| Galgon | 3,109 | €2,100/m² | €22,490 | 71% | 10% | 8.3% | 1% | 15 |
| Gradignan | 26,186 | €3,670/m² | €25,980 | 51% | 12% | 10.3% | 26% | 121 |
| Gujan-Mestras | 22,643 | €4,650/m² | €25,670 | 66% | 13% | 11.1% | 18% | 32 |
| Génissac | 2,026 | €2,500/m² | €24,120 | 71% | 5% | 9.2% | 8% | 13 |
| Hourtin | 4,028 | €3,500/m² | €23,480 | 69% | 12% | 14.9% | 0% | 25 |
| Izon | 6,347 | €2,780/m² | €24,460 | 78% | 7% | 7.8% | 19% | 24 |
| La Brède | 4,423 | €3,500/m² | €29,170 | 73% | 10% | 4.7% | 27% | 30 |
| La Lande-de-Fronsac | 2,739 | €2,480/m² | €24,990 | 85% | 8% | 6.5% | 2% | 16 |
| La Réole | 4,441 | €1,400/m² | €18,000 | 41% | 11% | 16.6% | 5% | 53 |
| La Teste-de-Buch | 27,141 | €5,220/m² | €24,540 | 58% | 16% | 11.5% | 49% | 36 |
| Lacanau | 5,389 | €5,180/m² | €25,500 | 77% | 14% | 8.9% | 7% | 22 |
| Landiras | 2,245 | €2,270/m² | €23,040 | 75% | 7% | 6.3% | 4% | 20 |
| Langoiran | 2,210 | €2,160/m² | €22,960 | 67% | 9% | 10.7% | 20% | 34 |
| Langon | 7,523 | €2,060/m² | €20,390 | 37% | 15% | 13.2% | 0% | 72 |
| Lanton | 7,315 | €4,310/m² | €25,910 | 69% | 15% | 11.8% | 27% | 36 |
| Laruscade | 2,808 | €1,950/m² | €21,290 | 76% | 6% | 10.2% | 25% | 9 |
| Latresne | 3,699 | €3,650/m² | €28,920 | 71% | 15% | 8.1% | 10% | 46 |
| Le Barp | 5,713 | €3,430/m² | €25,550 | 74% | 5% | 7.3% | 5% | 44 |
| Le Bouscat | 24,262 | €4,430/m² | €27,570 | 56% | 12% | 9.1% | 9% | 172 |
| Le Haillan | 11,499 | €3,700/m² | €25,760 | 52% | 7% | 8.8% | 20% | 50 |
| Le Pian-Médoc | 7,198 | €3,460/m² | €26,940 | 81% | 7% | 6.3% | 92% | 10 |
| Le Porge | 3,418 | €3,960/m² | €24,540 | 76% | 8% | 7.1% | 17% | 30 |
| Le Taillan-Médoc | 10,966 | €3,620/m² | €27,210 | 74% | 8% | 6.7% | 41% | 24 |
| Le Teich | 9,213 | €4,110/m² | €24,470 | 62% | 9% | 11.8% | 25% | 29 |
| Les Églisottes-et-Chalaures | 2,172 | €1,330/m² | €18,560 | 73% | 11% | 17.4% | 0% | 6 |
| Lesparre-Médoc | 5,862 | €1,880/m² | €19,470 | 56% | 13% | 17.3% | 1% | 57 |
| Libourne | 24,668 | €2,470/m² | €20,860 | 44% | 13% | 15.6% | 9% | 112 |
| Listrac-Médoc | 2,801 | €2,430/m² | €23,550 | 78% | 6% | 6.4% | 5% | 12 |
| Lormont | 24,654 | €2,680/m² | €18,200 | 29% | 8% | 18.0% | 17% | 101 |
| Ludon-Médoc | 5,466 | €3,180/m² | €25,760 | 79% | 6% | 6.2% | 13% | 23 |
| Lège-Cap-Ferret | 8,051 | €10,670/m² | €26,710 | 73% | 18% | 8.7% | 73% | 10 |
| Léognan | 10,723 | €3,610/m² | €27,890 | 71% | 12% | 7.9% | 33% | 18 |
| Macau | 4,575 | €2,890/m² | €23,950 | 70% | 6% | 9.0% | 2% | 20 |
| Marcheprime | 5,637 | €3,400/m² | €25,390 | 74% | 6% | 8.5% | 6% | 41 |
| Margaux-Cantenac | 2,844 | €2,600/m² | €23,770 | 71% | 7% | 7.9% | 3% | 18 |
| Martignas-sur-Jalle | 7,959 | €3,780/m² | €27,750 | 68% | 8% | 5.9% | 23% | 20 |
| Martillac | 3,581 | €3,580/m² | €28,340 | 78% | 6% | 5.4% | 0% | 13 |
| Mios | 11,756 | €3,790/m² | €25,670 | 78% | 5% | 6.6% | 53% | 6 |
| Montussan | 3,506 | €2,990/m² | €26,030 | 69% | 5% | 8.8% | 9% | 22 |
| Mérignac | 77,136 | €3,750/m² | €24,770 | 47% | 9% | 10.5% | 15% | 114 |
| Parempuyre | 10,407 | €3,420/m² | €23,910 | 57% | 7% | 7.8% | 26% | 27 |
| Pauillac | 5,165 | €1,590/m² | €19,270 | 49% | 11% | 19.5% | 10% | 25 |
| Pessac | 66,874 | €3,860/m² | €25,940 | 47% | 9% | 11.5% | 19% | 107 |
| Peujard | 2,191 | €2,450/m² | €23,550 | 77% | 7% | 9.3% | 3% | 13 |
| Pineuilh | 4,447 | €1,330/m² | €19,760 | 57% | 18% | 16.3% | 6% | 31 |
| Podensac | 3,300 | €2,420/m² | €22,260 | 68% | 13% | 12.6% | 1% | 27 |
| Pompignac | 3,485 | €3,280/m² | €28,280 | 78% | 9% | 6.9% | 13% | 16 |
| Portets | 2,638 | €2,580/m² | €24,360 | 73% | 10% | 5.7% | 3% | 15 |
| Preignac | 2,140 | €1,800/m² | €21,470 | 72% | 10% | 11.3% | 14% | 18 |
| Pugnac | 2,417 | €2,160/m² | €22,370 | 72% | 9% | 7.4% | 0% | 15 |
| Quinsac | 2,216 | €3,400/m² | €27,670 | 77% | 10% | 5.4% | 4% | 21 |
| Sadirac | 4,718 | €3,170/m² | €25,600 | 84% | 5% | 6.0% | 46% | 20 |
| Saint-André-de-Cubzac | 12,786 | €2,550/m² | €22,530 | 54% | 8% | 10.4% | 8% | 26 |
| Saint-Aubin-de-Médoc | 7,764 | €4,020/m² | €31,090 | 75% | 8% | 7.7% | 2% | 32 |
| Saint-Caprais-de-Bordeaux | 3,460 | €2,980/m² | €25,300 | 75% | 6% | 5.5% | 26% | 18 |
| Saint-Ciers-sur-Gironde | 3,128 | €1,310/m² | €20,420 | 66% | 13% | 13.1% | 0% | 32 |
| Saint-Denis-de-Pile | 5,916 | €2,010/m² | €21,860 | 70% | 11% | 10.5% | 20% | 26 |
| Saint-Germain-du-Puch | 2,290 | €2,590/m² | €25,460 | 77% | 10% | 6.3% | 1% | 16 |
| Saint-Jean-d'Illac | 9,702 | €3,800/m² | €27,540 | 64% | 4% | 7.5% | 70% | 8 |
| Saint-Laurent-Médoc | 4,950 | €2,240/m² | €22,770 | 71% | 7% | 11.2% | 19% | 27 |
| Saint-Loubès | 10,057 | €2,960/m² | €24,300 | 66% | 8% | 8.0% | 1% | 17 |
| Saint-Louis-de-Montferrand | 2,097 | €2,500/m² | €22,090 | 71% | 7% | 9.9% | 0% | 19 |
| Saint-Macaire | 2,000 | €1,910/m² | €21,150 | 50% | 14% | 11.0% | 6% | 30 |
| Saint-Magne-de-Castillon | 2,149 | €2,000/m² | €21,620 | 76% | 15% | 12.1% | 3% | 13 |
| Saint-Maixant | 2,046 | €2,210/m² | €21,930 | 74% | 9% | 10.5% | 3% | 16 |
| Saint-Médard-d'Eyrans | 3,361 | €3,360/m² | €26,690 | 77% | 6% | 5.6% | 4% | 20 |
| Saint-Médard-de-Guizières | 2,408 | €1,630/m² | €19,920 | 59% | 11% | 18.9% | 2% | 12 |
| Saint-Médard-en-Jalles | 32,749 | €3,730/m² | €26,740 | 64% | 10% | 7.8% | 20% | 45 |
| Saint-Quentin-de-Baron | 2,704 | €2,360/m² | €22,210 | 57% | 3% | 9.1% | 0% | 11 |
| Saint-Savin | 3,468 | €1,930/m² | €21,900 | 64% | 9% | 10.3% | 2% | 16 |
| Saint-Selve | 3,668 | €3,280/m² | €27,000 | 89% | 3% | 5.1% | 39% | 18 |
| Saint-Seurin-sur-l'Isle | 3,161 | €1,570/m² | €19,140 | 52% | 15% | 19.1% | 3% | 19 |
| Saint-Sulpice-et-Cameyrac | 4,879 | €2,790/m² | €25,480 | 70% | 11% | 7.4% | 0% | 20 |
| Saint-Yzan-de-Soudiac | 2,577 | €1,900/m² | €20,730 | 62% | 5% | 13.4% | 8% | 13 |
| Sainte-Eulalie | 4,922 | €2,980/m² | €24,470 | 75% | 8% | 10.3% | 2% | 31 |
| Sainte-Foy-la-Grande | 2,561 | €880/m² | €14,050 | 30% | 18% | 27.0% | 0% | 91 |
| Sainte-Hélène | 3,068 | €3,050/m² | €25,300 | 81% | 7% | 6.0% | 15% | 17 |
| Sallebœuf | 2,771 | €3,170/m² | €27,120 | 80% | 8% | 9.0% | 7% | 14 |
| Salles | 8,128 | €3,290/m² | €25,690 | 79% | 8% | 6.5% | 13% | 63 |
| Saucats | 3,446 | €3,250/m² | €27,530 | 84% | 5% | 6.9% | 36% | 10 |
| Soulac-sur-Mer | 3,011 | €3,540/m² | €22,700 | 70% | 25% | 11.7% | 8% | 60 |
| Talence | 45,869 | €4,180/m² | €24,260 | 32% | 7% | 13.3% | 11% | 206 |
| Targon | 2,045 | €2,330/m² | €22,930 | 68% | 12% | 6.7% | 5% | 15 |
| Toulenne | 2,860 | €2,120/m² | €21,740 | 60% | 11% | 11.8% | 20% | 47 |
| Tresses | 5,188 | €3,360/m² | €25,960 | 69% | 9% | 7.4% | 9% | 17 |
| Val de Virvée | 3,744 | €2,440/m² | €23,240 | 76% | 8% | 8.6% | 1% | 9 |
| Vayres | 4,414 | €2,500/m² | €23,750 | 65% | 9% | 9.2% | 0% | 21 |
| Vendays-Montalivet | 2,820 | €3,200/m² | €21,840 | 74% | 17% | 15.1% | 18% | 21 |
| Villenave-d'Ornon | 42,185 | €3,540/m² | €23,780 | 47% | 8% | 9.9% | 13% | 73 |
| Yvrac | 2,901 | €3,090/m² | €25,960 | 74% | 13% | 7.1% | 8% | 11 |
Sources: Insee, 2022 population census (sub-municipal files, Open Licence 2.0) · DGFiP property sales (DVF), data.gouv.fr statistics (Open Licence 2.0) · Insee, Filosofi 2021 income data (Open Licence 2.0) · © OpenStreetMap contributors (ODbL)
People.
1,674,980 residents and 788,832 households at the 2022 census, next to the département figure.
Source: Insee, 2022 population census (sub-municipal files, Open Licence 2.0)
Homes.
930,035 homes, 85% of them main residences, with 3.9 rooms on average.
When main homes were built
Source: Insee, 2022 population census (sub-municipal files, Open Licence 2.0)
Property prices.
114,991 house and flat sales over five years.
Median prices from sales published in France’s Demandes de valeurs foncières (DVF) over ten half-years, for sales of a single property. Individual sales are not shown. A median is only given where there were at least ten sales.
Source: DGFiP property sales (DVF), data.gouv.fr statistics (Open Licence 2.0)
Income and work.
Work and qualifications at the 2022 census.
Sources: Insee, 2022 population census (sub-municipal files, Open Licence 2.0)
Health, shops and services.
Facilities and services in Gironde on 1 January 2025, from Insee’s permanent database of facilities.
Insee’s permanent database of facilities lists the shops, services and health professionals present in each commune on 1 January. Health professionals in private practice are counted one by one; several may work at the same address.
Source: Insee, permanent database of facilities 2025 (Open Licence 2.0)
Natural and industrial hazards.
Share of the département’s 535 communes exposed to each major hazard, and natural-disaster declarations since 1982.
Natural-disaster declarations by type
A natural-disaster declaration (arrêté CatNat) lets insurers pay out for the damage. The count reflects past events, not a forecast of future risk. The list of hazards comes from each département’s major-risk file; a prevention plan in force limits building in exposed zones.
Source: Géorisques, GASPAR database (Open Licence 2.0), as of 5 October 2026
Communes.
268 communes in the département have their own page.