Haute-Savoie
Haute-Savoie has 849,583 residents in 279 communes. Over five years, homes sold for a median €4,400/m², from €2,590/m² in Cluses to €9,890/m² in Megève among communes of more than 2,000 people. 60% of households own their main home.
Four maps of Haute-Savoie.
Each commune is coloured by its value; every map uses the same colour scale, from lowest to highest. Grey: not published.
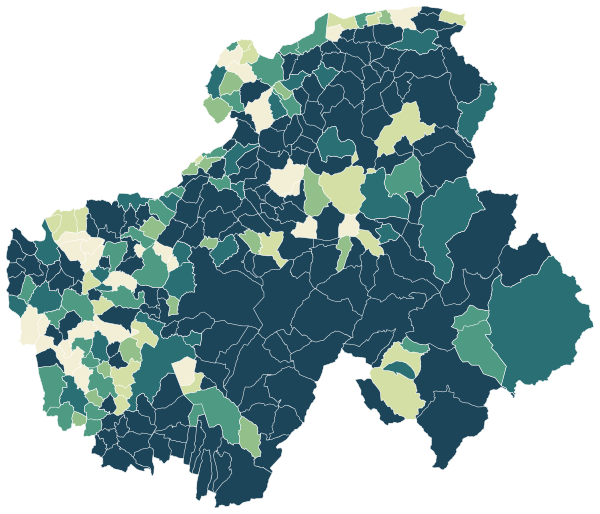
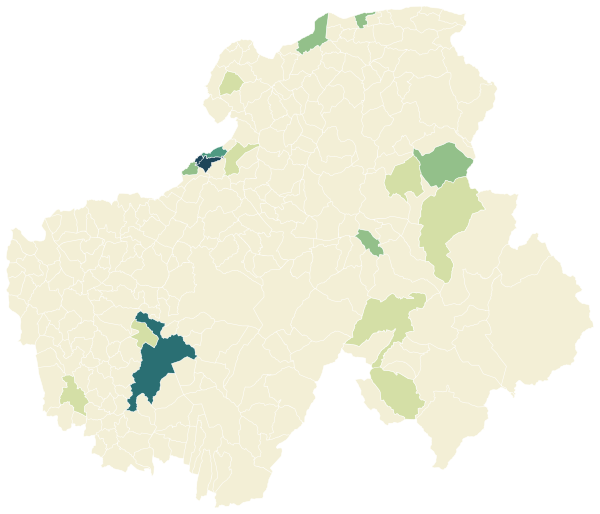
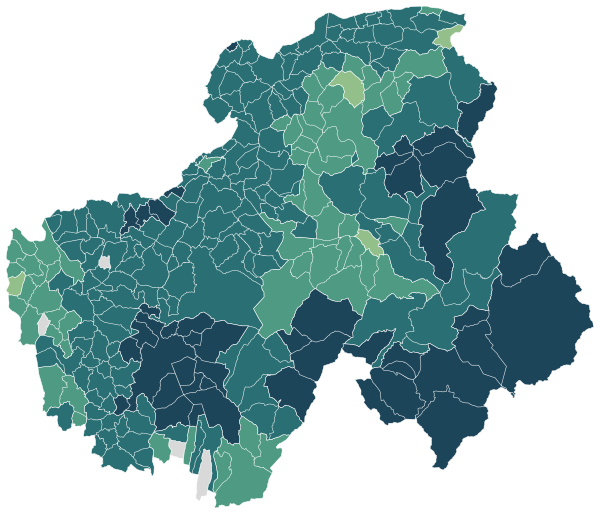
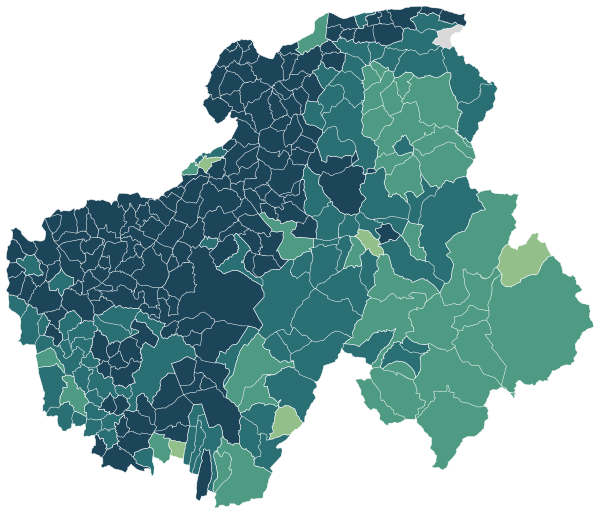
Sources: IGN and Insee, IRIS boundaries and Admin Express 2024 (Open Licence 2.0) · DGFiP property sales (DVF), data.gouv.fr statistics (Open Licence 2.0) · Insee, Filosofi 2021 income data (Open Licence 2.0) · © OpenStreetMap contributors (ODbL)
The 88 communes with more than 2,000 people.
Colour shows where each commune sits among the others in the table, from lowest to highest.
| Commune | Residents | Price per m² | Living standard | Home owners | Aged 75+ | Unemployment | Green 500 m | Services 15 min |
|---|---|---|---|---|---|---|---|---|
| Alby-sur-Chéran | 2,643 | €4,090/m² | €25,840 | 59% | 4% | 6.5% | 57% | 37 |
| Allinges | 4,938 | €4,040/m² | €32,070 | 83% | 8% | 7.6% | 52% | 19 |
| Allonzier-la-Caille | 2,170 | €4,630/m² | €32,440 | 58% | 4% | 8.5% | 42% | 23 |
| Amancy | 2,786 | €4,340/m² | €31,960 | 77% | 6% | 5.0% | 12% | 27 |
| Ambilly | 6,269 | €3,950/m² | €28,080 | 48% | 9% | 15.1% | 7% | 275 |
| Annecy | 131,272 | €5,210/m² | €26,250 | 49% | 11% | 8.9% | 22% | 228 |
| Annemasse | 37,595 | €3,530/m² | €22,800 | 37% | 6% | 16.0% | 11% | 318 |
| Anthy-sur-Léman | 2,370 | €4,910/m² | €33,690 | 76% | 9% | 6.4% | 20% | 44 |
| Archamps | 2,458 | €5,100/m² | €54,120 | 73% | 7% | 7.1% | 21% | 39 |
| Argonay | 3,713 | €5,950/m² | €30,740 | 57% | 8% | 5.9% | 40% | 55 |
| Ayse | 2,325 | €4,160/m² | €32,680 | 77% | 10% | 5.8% | 1% | 11 |
| Beaumont | 3,081 | €4,930/m² | €44,180 | 66% | 5% | 7.3% | 14% | 32 |
| Bonne | 3,268 | €4,100/m² | €36,440 | 70% | 9% | 8.3% | 34% | 34 |
| Bonneville | 13,320 | €3,360/m² | €25,180 | 49% | 6% | 10.9% | 42% | 45 |
| Bons-en-Chablais | 6,120 | €4,120/m² | €33,300 | 63% | 6% | 7.4% | 3% | 35 |
| Chamonix-Mont-Blanc | 8,673 | €9,390/m² | €24,310 | 53% | 11% | 3.5% | 23% | 59 |
| Chavanod | 3,024 | €4,820/m² | €29,300 | 76% | 10% | 4.8% | 7% | 27 |
| Chens-sur-Léman | 3,005 | €4,560/m² | €40,580 | 63% | 5% | 7.9% | 27% | 24 |
| Cluses | 17,366 | €2,590/m² | €21,720 | 47% | 8% | 13.4% | 6% | 106 |
| Collonges-sous-Salève | 3,876 | €4,950/m² | €46,700 | 57% | 10% | 9.2% | 23% | 53 |
| Combloux | 2,094 | €5,920/m² | €27,430 | 72% | 9% | 3.1% | 10% | 37 |
| Contamine-sur-Arve | 2,374 | €4,080/m² | €35,710 | 76% | 5% | 5.9% | 57% | 21 |
| Cranves-Sales | 7,476 | €4,550/m² | €36,420 | 72% | 8% | 9.6% | 27% | 65 |
| Cruseilles | 5,058 | €4,560/m² | €34,800 | 54% | 7% | 7.9% | 17% | 37 |
| Domancy | 2,203 | €4,220/m² | €28,140 | 80% | 8% | 3.7% | 19% | 12 |
| Doussard | 3,688 | €4,750/m² | €26,420 | 67% | 10% | 8.5% | 43% | 33 |
| Douvaine | 6,788 | €4,070/m² | €32,160 | 54% | 6% | 10.5% | 14% | 63 |
| Epagny Metz-Tessy | 8,642 | €5,450/m² | €30,270 | 64% | 5% | 7.3% | 5% | 85 |
| Etaux | 2,109 | €4,260/m² | €36,340 | 86% | 5% | 4.5% | 29% | 32 |
| Faverges-Seythenex | 7,540 | €3,140/m² | €23,620 | 61% | 12% | 10.3% | 38% | 37 |
| Fillinges | 3,550 | €4,140/m² | €36,920 | 82% | 6% | 6.7% | 51% | 24 |
| Fillière | 9,812 | €4,670/m² | €32,280 | 78% | 7% | 5.7% | 48% | 34 |
| Frangy | 2,136 | €3,700/m² | €28,270 | 62% | 10% | 7.4% | 36% | 21 |
| Gaillard | 11,054 | €3,650/m² | €25,070 | 36% | 8% | 17.1% | 12% | 108 |
| Groisy | 4,044 | €4,760/m² | €33,100 | 69% | 7% | 5.3% | 27% | 25 |
| La Balme-de-Sillingy | 5,215 | €4,450/m² | €28,140 | 67% | 6% | 7.7% | 50% | 25 |
| La Roche-sur-Foron | 11,239 | €3,750/m² | €28,670 | 51% | 7% | 8.2% | 47% | 52 |
| Le Grand-Bornand | 2,054 | €6,270/m² | €25,830 | 72% | 11% | 1.5% | 39% | 53 |
| Les Houches | 3,529 | €6,950/m² | €24,290 | 64% | 7% | 4.7% | 19% | 33 |
| Lugrin | 2,536 | €3,640/m² | €33,530 | 72% | 8% | 11.1% | 2% | 24 |
| Magland | 3,242 | €2,960/m² | €24,760 | 69% | 9% | 7.7% | 53% | 25 |
| Margencel | 2,261 | €4,140/m² | €32,410 | 75% | 7% | 7.7% | 63% | 27 |
| Marignier | 6,432 | €3,410/m² | €26,980 | 68% | 8% | 7.2% | 59% | 4 |
| Marnaz | 5,920 | €2,920/m² | €25,900 | 65% | 7% | 9.3% | 11% | 12 |
| Megève | 2,927 | €9,890/m² | €24,480 | 61% | 18% | 4.2% | 6% | 77 |
| Messery | 2,373 | €4,780/m² | €44,650 | 71% | 8% | 7.9% | 1% | 17 |
| Mieussy | 2,521 | €3,630/m² | €29,350 | 74% | 6% | 4.2% | 7% | 26 |
| Monnetier-Mornex | 2,333 | €3,900/m² | €38,520 | 74% | 7% | 10.0% | 64% | 19 |
| Morzine | 2,661 | €7,370/m² | €24,600 | 69% | 13% | 2.4% | 36% | 111 |
| Neuvecelle | 3,224 | €4,590/m² | €36,690 | 76% | 9% | 8.7% | 9% | 41 |
| Neydens | 2,227 | €5,070/m² | €45,460 | 68% | 4% | 7.1% | 30% | 25 |
| Passy | 10,852 | €3,620/m² | €25,320 | 61% | 10% | 6.8% | 57% | 8 |
| Pers-Jussy | 3,207 | €4,240/m² | €36,640 | 83% | 7% | 5.0% | 60% | 18 |
| Poisy | 9,032 | €5,240/m² | €29,330 | 63% | 8% | 6.4% | 13% | 51 |
| Publier | 7,793 | €4,640/m² | €29,490 | 59% | 7% | 10.0% | 7% | 33 |
| Reignier-Ésery | 8,112 | €4,290/m² | €33,160 | 57% | 8% | 8.3% | 48% | 15 |
| Rumilly | 16,082 | €3,410/m² | €23,260 | 54% | 8% | 9.7% | 29% | 62 |
| Saint-Cergues | 3,779 | €4,270/m² | €33,860 | 72% | 9% | 7.9% | 37% | 14 |
| Saint-Félix | 2,438 | €3,720/m² | €26,300 | 68% | 7% | 5.5% | 19% | 16 |
| Saint-Gervais-les-Bains | 5,678 | €5,180/m² | €24,640 | 64% | 11% | 4.1% | 80% | 9 |
| Saint-Jeoire | 3,423 | €2,990/m² | €27,090 | 65% | 6% | 8.9% | 13% | 33 |
| Saint-Jorioz | 6,344 | €5,670/m² | €29,810 | 71% | 13% | 7.1% | 100% | 0 |
| Saint-Julien-en-Genevois | 15,925 | €4,720/m² | €34,430 | 43% | 6% | 12.8% | 27% | 48 |
| Saint-Paul-en-Chablais | 2,598 | €4,090/m² | €30,180 | 79% | 8% | 6.1% | 48% | 20 |
| Saint-Pierre-en-Faucigny | 7,848 | €4,160/m² | €29,510 | 64% | 6% | 7.6% | 6% | 20 |
| Sales | 2,267 | €3,950/m² | €27,780 | 88% | 6% | 4.4% | 0% | 10 |
| Sallanches | 17,041 | €3,790/m² | €24,950 | 59% | 10% | 5.8% | 35% | 76 |
| Samoëns | 2,193 | €5,090/m² | €25,680 | 68% | 12% | 3.8% | 26% | 92 |
| Sciez | 6,317 | €4,150/m² | €31,650 | 66% | 7% | 11.1% | 21% | 48 |
| Scionzier | 9,074 | €2,850/m² | €23,550 | 53% | 5% | 12.3% | 54% | 40 |
| Sevrier | 4,324 | €6,190/m² | €31,540 | 69% | 11% | 8.0% | 33% | 42 |
| Seyssel | 2,327 | €3,050/m² | €25,710 | 64% | 10% | 8.1% | 3% | 43 |
| Sillingy | 5,652 | €4,690/m² | €28,530 | 69% | 6% | 7.1% | 2% | 28 |
| Taninges | 3,501 | €3,880/m² | €25,580 | 68% | 10% | 5.0% | 30% | 49 |
| Thonon-les-Bains | 37,689 | €3,710/m² | €24,450 | 46% | 11% | 12.2% | 18% | 105 |
| Thyez | 6,344 | €3,140/m² | €26,840 | 61% | 10% | 8.1% | 5% | 31 |
| Thônes | 6,654 | €4,680/m² | €25,350 | 55% | 10% | 5.0% | 100% | 1 |
| Valleiry | 5,090 | €4,340/m² | €37,380 | 58% | 5% | 8.7% | 8% | 34 |
| Vallières-sur-Fier | 2,739 | €3,660/m² | €26,300 | 77% | 7% | 4.7% | 0% | 16 |
| Veigy-Foncenex | 4,035 | €4,620/m² | €44,280 | 68% | 7% | 10.0% | 11% | 37 |
| Veyrier-du-Lac | 2,308 | €9,480/m² | €44,530 | 80% | 18% | 7.7% | 1% | 35 |
| Villaz | 3,473 | €5,440/m² | €32,720 | 73% | 7% | 4.1% | 40% | 15 |
| Ville-la-Grand | 9,196 | €3,940/m² | €27,930 | 49% | 7% | 13.9% | 20% | 175 |
| Viry | 5,625 | €4,670/m² | €40,950 | 60% | 5% | 8.7% | 33% | 36 |
| Viuz-en-Sallaz | 4,668 | €3,860/m² | €31,760 | 70% | 7% | 6.5% | 1% | 38 |
| Vétraz-Monthoux | 10,412 | €4,290/m² | €32,820 | 56% | 7% | 10.3% | 35% | 55 |
| Étrembières | 2,624 | €4,610/m² | €30,250 | 50% | 6% | 12.4% | 59% | 39 |
| Évian-les-Bains | 9,224 | €4,830/m² | €27,820 | 44% | 11% | 12.9% | 18% | 125 |
Sources: Insee, 2022 population census (sub-municipal files, Open Licence 2.0) · DGFiP property sales (DVF), data.gouv.fr statistics (Open Licence 2.0) · Insee, Filosofi 2021 income data (Open Licence 2.0) · © OpenStreetMap contributors (ODbL)
People.
849,583 residents and 384,130 households at the 2022 census, next to the département figure.
Source: Insee, 2022 population census (sub-municipal files, Open Licence 2.0)
Homes.
548,601 homes, 70% of them main residences, with 3.9 rooms on average.
When main homes were built
Source: Insee, 2022 population census (sub-municipal files, Open Licence 2.0)
Property prices.
78,040 house and flat sales over five years.
Median prices from sales published in France’s Demandes de valeurs foncières (DVF) over ten half-years, for sales of a single property. Individual sales are not shown. A median is only given where there were at least ten sales.
Source: DGFiP property sales (DVF), data.gouv.fr statistics (Open Licence 2.0)
Income and work.
Work and qualifications at the 2022 census.
Sources: Insee, 2022 population census (sub-municipal files, Open Licence 2.0)
Health, shops and services.
Facilities and services in Haute-Savoie on 1 January 2025, from Insee’s permanent database of facilities.
Insee’s permanent database of facilities lists the shops, services and health professionals present in each commune on 1 January. Health professionals in private practice are counted one by one; several may work at the same address.
Source: Insee, permanent database of facilities 2025 (Open Licence 2.0)
Natural and industrial hazards.
Share of the département’s 279 communes exposed to each major hazard, and natural-disaster declarations since 1982.
Natural-disaster declarations by type
A natural-disaster declaration (arrêté CatNat) lets insurers pay out for the damage. The count reflects past events, not a forecast of future risk. The list of hazards comes from each département’s major-risk file; a prevention plan in force limits building in exposed zones.
Source: Géorisques, GASPAR database (Open Licence 2.0), as of 5 October 2026
Every commune.
Every commune has its own page.