Hérault
Hérault has 1,217,331 residents in 342 communes. Over five years, homes sold for a median €3,200/m², from €1,060/m² in Bédarieux to €5,270/m² in La Grande-Motte among communes of more than 2,000 people. 53% of households own their main home.
Four maps of Hérault.
Each commune is coloured by its value; every map uses the same colour scale, from lowest to highest. Grey: not published.
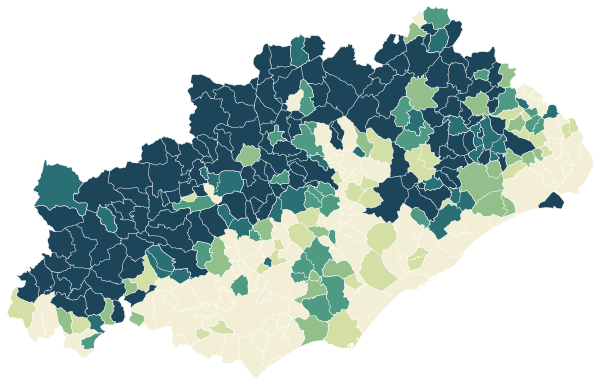
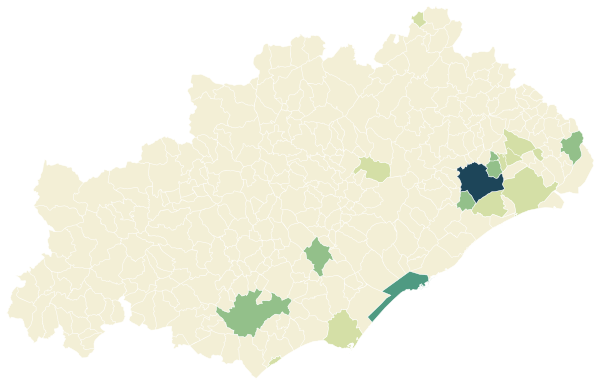
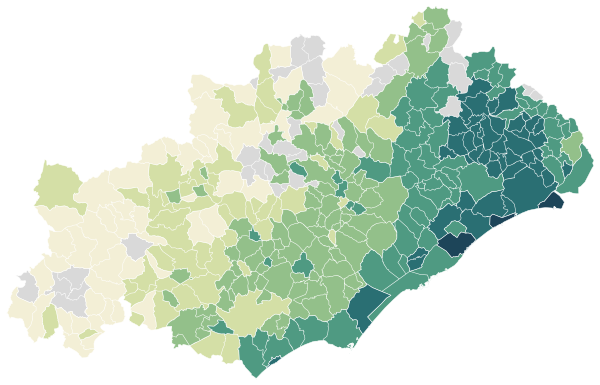
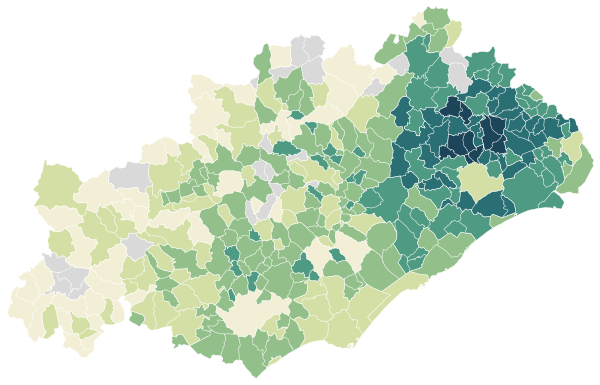
Sources: IGN and Insee, IRIS boundaries and Admin Express 2024 (Open Licence 2.0) · DGFiP property sales (DVF), data.gouv.fr statistics (Open Licence 2.0) · Insee, Filosofi 2021 income data (Open Licence 2.0) · © OpenStreetMap contributors (ODbL)
The 113 communes with more than 2,000 people.
Colour shows where each commune sits among the others in the table, from lowest to highest.
| Commune | Residents | Price per m² | Living standard | Home owners | Aged 75+ | Unemployment | Green 500 m | Services 15 min |
|---|---|---|---|---|---|---|---|---|
| Agde | 29,612 | €3,580/m² | €20,410 | 55% | 16% | 24.7% | 9% | 83 |
| Aniane | 2,956 | €2,550/m² | €22,130 | 63% | 11% | 11.6% | 9% | 36 |
| Baillargues | 7,793 | €3,900/m² | €25,640 | 61% | 8% | 10.3% | 14% | 52 |
| Balaruc-le-Vieux | 2,749 | €3,660/m² | €24,440 | 73% | 12% | 10.2% | 9% | 42 |
| Balaruc-les-Bains | 7,136 | €4,140/m² | €23,210 | 65% | 15% | 13.7% | 10% | 50 |
| Bassan | 2,353 | €2,440/m² | €22,540 | 72% | 11% | 11.3% | 1% | 18 |
| Beaulieu | 2,239 | €3,790/m² | €27,020 | 78% | 9% | 6.1% | 19% | 33 |
| Bessan | 5,705 | €2,310/m² | €20,810 | 64% | 11% | 14.5% | 16% | 8 |
| Boisseron | 2,178 | €3,230/m² | €25,430 | 77% | 9% | 9.3% | 29% | 23 |
| Boujan-sur-Libron | 3,536 | €2,320/m² | €22,710 | 58% | 18% | 10.5% | 1% | 42 |
| Bédarieux | 5,820 | €1,060/m² | €18,140 | 54% | 15% | 20.7% | 23% | 50 |
| Béziers | 80,815 | €1,850/m² | €16,830 | 40% | 12% | 21.5% | 4% | 127 |
| Candillargues | 2,102 | €3,810/m² | €25,040 | 74% | 6% | 6.6% | 2% | 21 |
| Canet | 3,600 | €2,810/m² | €22,940 | 75% | 8% | 10.1% | 0% | 35 |
| Capestang | 3,413 | €2,040/m² | €20,850 | 69% | 13% | 11.5% | 1% | 48 |
| Castelnau-le-Lez | 25,404 | €4,050/m² | €25,160 | 47% | 10% | 9.8% | 13% | 125 |
| Castries | 6,722 | €3,920/m² | €26,010 | 63% | 12% | 9.1% | 37% | 61 |
| Caux | 2,692 | €2,300/m² | €21,810 | 71% | 13% | 14.4% | 9% | 38 |
| Cazouls-lès-Béziers | 5,185 | €1,860/m² | €20,990 | 68% | 10% | 15.5% | 1% | 41 |
| Cers | 2,523 | €2,510/m² | €21,550 | 69% | 13% | 14.6% | 1% | 15 |
| Cessenon-sur-Orb | 2,390 | €1,700/m² | €21,500 | 72% | 15% | 16.3% | 33% | 20 |
| Clapiers | 6,010 | €4,130/m² | €28,000 | 66% | 10% | 9.1% | 66% | 59 |
| Clermont-l'Hérault | 9,372 | €2,310/m² | €19,320 | 47% | 12% | 16.7% | 56% | 32 |
| Colombiers | 2,755 | €2,730/m² | €22,970 | 67% | 12% | 13.1% | 6% | 41 |
| Cournonsec | 3,583 | €3,530/m² | €24,160 | 72% | 7% | 9.9% | 21% | 44 |
| Cournonterral | 7,019 | €3,300/m² | €22,850 | 67% | 8% | 9.6% | 42% | 18 |
| Entre-Vignes | 2,186 | €2,930/m² | €25,740 | 78% | 9% | 6.2% | 0% | 23 |
| Fabrègues | 7,200 | €3,620/m² | €24,410 | 69% | 10% | 9.1% | 25% | 19 |
| Florensac | 5,138 | €2,430/m² | €20,750 | 70% | 14% | 13.0% | 15% | 46 |
| Frontignan | 23,788 | €3,450/m² | €21,830 | 61% | 13% | 14.6% | 2% | 49 |
| Ganges | 3,854 | €1,530/m² | €17,450 | 42% | 20% | 19.8% | 3% | 64 |
| Gigean | 6,559 | €3,110/m² | €22,830 | 71% | 7% | 10.5% | 0% | 54 |
| Gignac | 6,713 | €2,780/m² | €21,810 | 59% | 8% | 13.9% | 1% | 95 |
| Grabels | 9,060 | €3,270/m² | €24,100 | 49% | 8% | 11.2% | 64% | 49 |
| Jacou | 6,964 | €3,990/m² | €26,300 | 64% | 7% | 10.9% | 25% | 111 |
| Juvignac | 13,776 | €3,280/m² | €23,130 | 52% | 10% | 13.7% | 66% | 33 |
| La Grande-Motte | 8,508 | €5,270/m² | €23,390 | 62% | 25% | 15.5% | 33% | 33 |
| Lamalou-les-Bains | 2,421 | €2,120/m² | €21,110 | 58% | 24% | 12.8% | 41% | 50 |
| Lansargues | 3,130 | €3,260/m² | €24,270 | 67% | 8% | 11.8% | 2% | 32 |
| Lattes | 17,592 | €4,600/m² | €26,460 | 60% | 12% | 9.5% | 13% | 73 |
| Lavérune | 3,298 | €3,580/m² | €25,360 | 63% | 9% | 14.1% | 24% | 49 |
| Le Crès | 9,267 | €4,060/m² | €25,900 | 67% | 12% | 11.0% | 42% | 75 |
| Le Pouget | 2,101 | €2,550/m² | €22,190 | 73% | 10% | 11.4% | 6% | 26 |
| Les Matelles | 2,068 | €3,830/m² | €28,150 | 79% | 11% | 5.7% | 30% | 29 |
| Lespignan | 3,355 | €1,960/m² | €21,340 | 73% | 11% | 17.1% | 0% | 29 |
| Lignan-sur-Orb | 3,227 | €2,470/m² | €23,050 | 78% | 13% | 10.2% | 2% | 25 |
| Lodève | 7,202 | €1,450/m² | €18,140 | 47% | 15% | 19.9% | 72% | 29 |
| Loupian | 2,179 | €3,230/m² | €21,680 | 73% | 9% | 12.9% | 3% | 35 |
| Lunel | 26,380 | €2,640/m² | €19,600 | 55% | 12% | 18.0% | 2% | 122 |
| Lunel-Viel | 4,497 | €3,130/m² | €21,680 | 64% | 9% | 11.5% | 3% | 37 |
| Magalas | 3,531 | €2,310/m² | €21,650 | 79% | 11% | 13.4% | 4% | 30 |
| Maraussan | 4,693 | €2,230/m² | €21,930 | 67% | 11% | 10.1% | 5% | 21 |
| Marseillan | 8,047 | €3,840/m² | €20,880 | 60% | 18% | 16.7% | 4% | 29 |
| Marsillargues | 6,787 | €2,880/m² | €21,260 | 58% | 11% | 11.2% | 0% | 21 |
| Mauguio | 16,417 | €4,470/m² | €25,140 | 61% | 15% | 12.0% | 2% | 72 |
| Maureilhan | 2,465 | €2,230/m² | €22,070 | 79% | 11% | 10.7% | 0% | 15 |
| Mireval | 3,301 | €3,530/m² | €24,520 | 73% | 11% | 8.0% | 0% | 25 |
| Montady | 4,020 | €2,490/m² | €22,230 | 80% | 12% | 11.7% | 0% | 33 |
| Montagnac | 4,465 | €2,160/m² | €18,320 | 66% | 12% | 18.6% | 0% | 31 |
| Montarnaud | 4,186 | €3,300/m² | €24,730 | 79% | 6% | 8.5% | 10% | 41 |
| Montbazin | 2,903 | €2,740/m² | €23,620 | 77% | 9% | 9.2% | 1% | 20 |
| Montblanc | 2,896 | €2,480/m² | €22,230 | 73% | 13% | 11.5% | 3% | 23 |
| Montferrier-sur-Lez | 4,117 | €4,550/m² | €33,630 | 70% | 14% | 9.6% | 25% | 55 |
| Montpellier | 307,101 | €3,410/m² | €19,670 | 31% | 7% | 18.5% | 13% | 357 |
| Mudaison | 2,954 | €3,740/m² | €24,820 | 72% | 9% | 7.2% | 3% | 37 |
| Murviel-lès-Béziers | 3,038 | €1,720/m² | €21,120 | 72% | 12% | 10.5% | 11% | 19 |
| Murviel-lès-Montpellier | 2,002 | €3,530/m² | €25,830 | 83% | 8% | 7.9% | 26% | 24 |
| Mèze | 12,711 | €3,460/m² | €21,470 | 57% | 15% | 16.7% | 7% | 34 |
| Nissan-lez-Enserune | 4,077 | €1,970/m² | €21,220 | 71% | 12% | 14.1% | 1% | 41 |
| Palavas-les-Flots | 6,007 | €5,080/m² | €22,190 | 51% | 21% | 12.3% | 0% | 16 |
| Paulhan | 4,022 | €2,450/m² | €20,570 | 70% | 13% | 18.8% | 1% | 33 |
| Pignan | 8,326 | €3,510/m² | €24,090 | 67% | 9% | 9.3% | 43% | 13 |
| Pinet | 2,012 | €2,620/m² | €21,800 | 69% | 11% | 12.8% | 6% | 11 |
| Pomérols | 2,255 | €2,630/m² | €21,510 | 78% | 14% | 15.6% | 1% | 20 |
| Portiragnes | 3,388 | €3,380/m² | €22,350 | 68% | 15% | 15.6% | 0% | 26 |
| Poussan | 6,540 | €3,090/m² | €23,060 | 70% | 10% | 9.1% | 1% | 28 |
| Prades-le-Lez | 6,207 | €4,040/m² | €26,410 | 66% | 7% | 7.6% | 29% | 35 |
| Puisserguier | 3,034 | €1,630/m² | €20,670 | 72% | 15% | 16.6% | 0% | 21 |
| Pérols | 9,541 | €4,590/m² | €26,950 | 68% | 13% | 12.7% | 14% | 57 |
| Pézenas | 7,789 | €2,270/m² | €18,750 | 48% | 16% | 18.7% | 18% | 131 |
| Restinclières | 2,573 | €3,780/m² | €26,280 | 77% | 4% | 8.7% | 18% | 30 |
| Roujan | 2,297 | €2,260/m² | €21,360 | 75% | 15% | 14.2% | 1% | 31 |
| Saint-André-de-Sangonis | 6,364 | €2,640/m² | €21,660 | 69% | 9% | 13.5% | 0% | 50 |
| Saint-Aunès | 4,333 | €4,180/m² | €27,160 | 70% | 7% | 6.2% | 6% | 24 |
| Saint-Brès | 3,462 | €3,710/m² | €24,650 | 63% | 8% | 8.6% | 13% | 63 |
| Saint-Clément-de-Rivière | 5,140 | €4,370/m² | €34,870 | 71% | 18% | 9.3% | 62% | 15 |
| Saint-Drézéry | 2,952 | €3,870/m² | €27,330 | 77% | 6% | 8.9% | 14% | 25 |
| Saint-Geniès-des-Mourgues | 2,112 | €3,640/m² | €27,690 | 71% | 8% | 6.6% | 9% | 26 |
| Saint-Georges-d'Orques | 5,707 | €3,260/m² | €25,520 | 63% | 10% | 12.8% | 33% | 32 |
| Saint-Gély-du-Fesc | 10,530 | €4,140/m² | €29,940 | 75% | 11% | 8.0% | 44% | 46 |
| Saint-Jean-de-Védas | 13,300 | €4,090/m² | €25,510 | 56% | 10% | 10.2% | 28% | 111 |
| Saint-Just | 3,290 | €3,450/m² | €24,370 | 69% | 6% | 9.5% | 3% | 35 |
| Saint-Martin-de-Londres | 2,728 | €3,350/m² | €24,630 | 71% | 9% | 6.7% | 11% | 49 |
| Saint-Mathieu-de-Tréviers | 4,869 | €3,840/m² | €25,010 | 66% | 8% | 10.8% | 13% | 56 |
| Saint-Pargoire | 2,438 | €2,370/m² | €20,910 | 78% | 10% | 10.0% | 0% | 17 |
| Saint-Thibéry | 3,047 | €2,230/m² | €20,600 | 69% | 9% | 13.1% | 11% | 24 |
| Sauvian | 5,498 | €2,830/m² | €22,270 | 72% | 11% | 16.1% | 0% | 32 |
| Servian | 5,427 | €2,240/m² | €21,670 | 69% | 10% | 12.5% | 4% | 41 |
| Sussargues | 2,817 | €3,760/m² | €28,460 | 76% | 8% | 10.4% | 8% | 37 |
| Sète | 45,090 | €3,400/m² | €19,960 | 47% | 17% | 18.0% | 3% | 175 |
| Sérignan | 8,437 | €3,030/m² | €21,240 | 60% | 15% | 16.4% | 1% | 37 |
| Teyran | 4,729 | €4,070/m² | €29,970 | 81% | 13% | 7.4% | 24% | 45 |
| Thézan-lès-Béziers | 3,070 | €2,220/m² | €22,860 | 71% | 12% | 14.3% | 0% | 39 |
| Vailhauquès | 2,684 | €3,480/m² | €27,230 | 81% | 7% | 6.9% | 6% | 24 |
| Valergues | 2,173 | €3,590/m² | €24,940 | 75% | 6% | 7.7% | 6% | 25 |
| Valras-Plage | 4,300 | €3,600/m² | €20,760 | 60% | 28% | 22.7% | 0% | 81 |
| Vendargues | 7,157 | €3,850/m² | €25,340 | 61% | 9% | 7.0% | 11% | 86 |
| Vendres | 2,671 | €3,280/m² | €22,350 | 72% | 12% | 14.2% | 0% | 20 |
| Vias | 5,960 | €3,000/m² | €19,780 | 61% | 14% | 17.4% | 13% | 21 |
| Vic-la-Gardiole | 3,413 | €5,050/m² | €22,730 | 66% | 8% | 12.0% | 1% | 37 |
| Villeneuve-lès-Béziers | 4,283 | €2,090/m² | €20,500 | 62% | 12% | 17.9% | 5% | 38 |
| Villeneuve-lès-Maguelone | 10,406 | €3,780/m² | €24,010 | 66% | 8% | 11.6% | 4% | 42 |
| Villeveyrac | 3,953 | €2,580/m² | €22,720 | 73% | 10% | 10.1% | 8% | 23 |
Sources: Insee, 2022 population census (sub-municipal files, Open Licence 2.0) · DGFiP property sales (DVF), data.gouv.fr statistics (Open Licence 2.0) · Insee, Filosofi 2021 income data (Open Licence 2.0) · © OpenStreetMap contributors (ODbL)
People.
1,217,331 residents and 585,084 households at the 2022 census, next to the département figure.
Source: Insee, 2022 population census (sub-municipal files, Open Licence 2.0)
Homes.
772,408 homes, 76% of them main residences, with 3.7 rooms on average.
When main homes were built
Source: Insee, 2022 population census (sub-municipal files, Open Licence 2.0)
Property prices.
108,892 house and flat sales over five years.
Median prices from sales published in France’s Demandes de valeurs foncières (DVF) over ten half-years, for sales of a single property. Individual sales are not shown. A median is only given where there were at least ten sales.
Source: DGFiP property sales (DVF), data.gouv.fr statistics (Open Licence 2.0)
Income and work.
Work and qualifications at the 2022 census.
Sources: Insee, 2022 population census (sub-municipal files, Open Licence 2.0)
Health, shops and services.
Facilities and services in Hérault on 1 January 2025, from Insee’s permanent database of facilities.
Insee’s permanent database of facilities lists the shops, services and health professionals present in each commune on 1 January. Health professionals in private practice are counted one by one; several may work at the same address.
Source: Insee, permanent database of facilities 2025 (Open Licence 2.0)
Natural and industrial hazards.
Share of the département’s 342 communes exposed to each major hazard, and natural-disaster declarations since 1982.
Natural-disaster declarations by type
A natural-disaster declaration (arrêté CatNat) lets insurers pay out for the damage. The count reflects past events, not a forecast of future risk. The list of hazards comes from each département’s major-risk file; a prevention plan in force limits building in exposed zones.
Source: Géorisques, GASPAR database (Open Licence 2.0), as of 5 October 2026
Communes.
257 communes in the département have their own page.