Ille-et-Vilaine
Ille-et-Vilaine has 1,109,232 residents in 332 communes. Over five years, homes sold for a median €2,780/m², from €1,270/m² in Val-Couesnon to €5,990/m² in Saint-Briac-sur-Mer among communes of more than 2,000 people. 60% of households own their main home.
Four maps of Ille-et-Vilaine.
Each commune is coloured by its value; every map uses the same colour scale, from lowest to highest. Grey: not published.
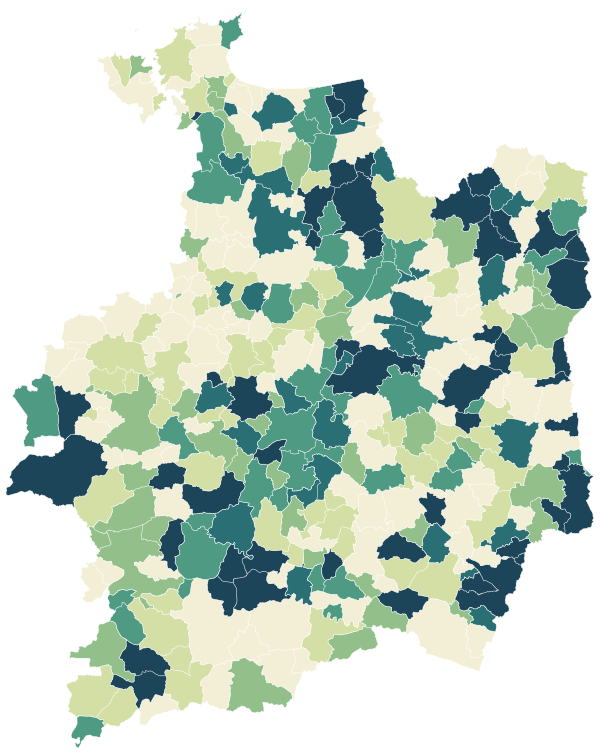
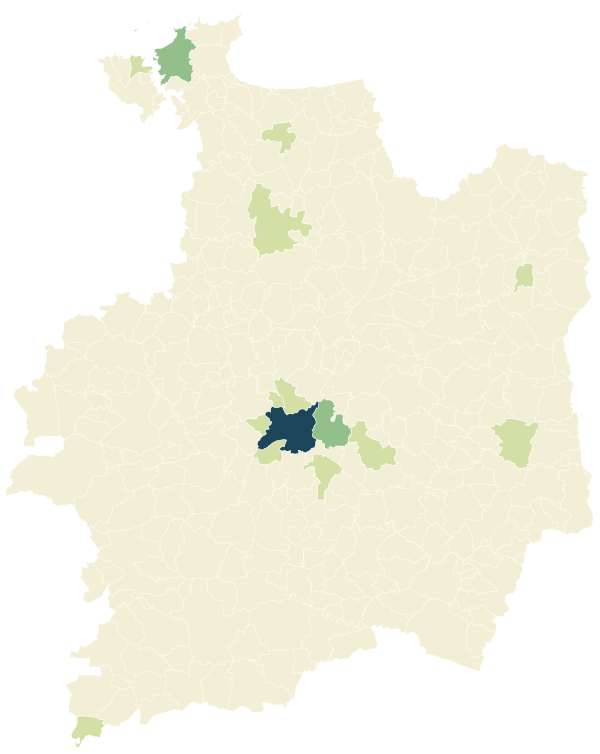
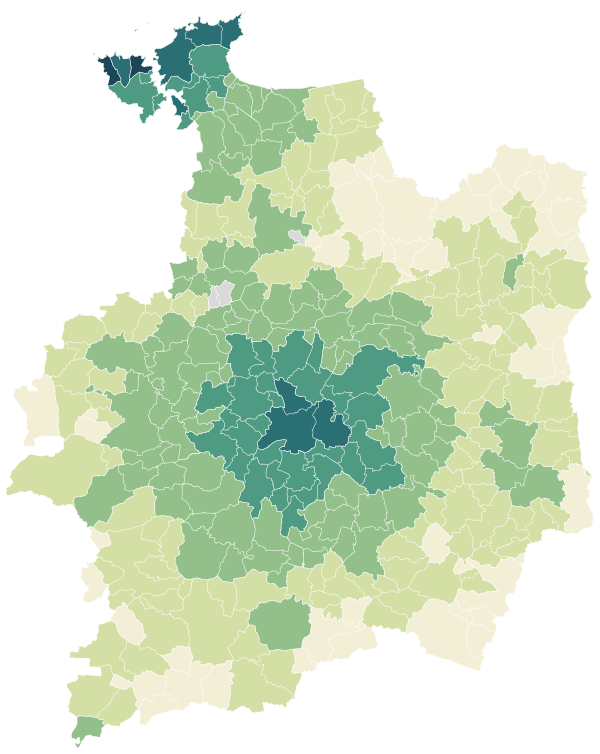
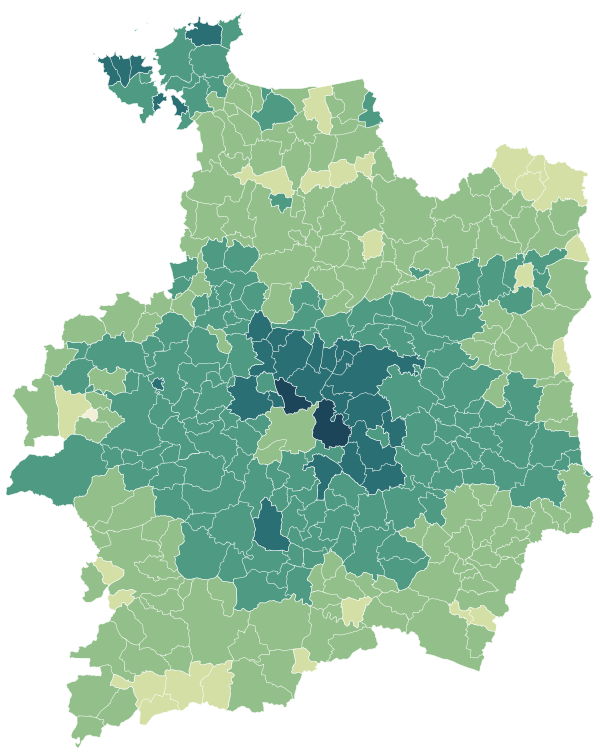
Sources: IGN and Insee, IRIS boundaries and Admin Express 2024 (Open Licence 2.0) · DGFiP property sales (DVF), data.gouv.fr statistics (Open Licence 2.0) · Insee, Filosofi 2021 income data (Open Licence 2.0) · © OpenStreetMap contributors (ODbL)
The 127 communes with more than 2,000 people.
Colour shows where each commune sits among the others in the table, from lowest to highest.
| Commune | Residents | Price per m² | Living standard | Home owners | Aged 75+ | Unemployment | Green 500 m | Services 15 min |
|---|---|---|---|---|---|---|---|---|
| Acigné | 6,911 | €3,070/m² | €25,850 | 67% | 7% | 6.8% | 3% | 4 |
| Argentré-du-Plessis | 4,591 | €2,040/m² | €23,260 | 68% | 10% | 6.3% | 12% | 39 |
| Bain-de-Bretagne | 7,704 | €2,190/m² | €22,930 | 67% | 11% | 7.0% | 2% | 43 |
| Bains-sur-Oust | 3,521 | €1,790/m² | €22,800 | 78% | 9% | 9.3% | 5% | 15 |
| Bais | 2,511 | €1,830/m² | €22,050 | 72% | 10% | 5.2% | 3% | 12 |
| Balazé | 2,181 | €1,870/m² | €23,290 | 76% | 6% | 4.8% | 3% | 13 |
| Baulon | 2,208 | €2,220/m² | €23,460 | 81% | 5% | 4.6% | 2% | 12 |
| Betton | 12,775 | €3,400/m² | €26,890 | 65% | 7% | 7.3% | 16% | 58 |
| Bourg-des-Comptes | 3,388 | €2,270/m² | €24,440 | 78% | 6% | 4.9% | 31% | 24 |
| Bourgbarré | 4,692 | €2,660/m² | €24,630 | 73% | 5% | 6.2% | 5% | 35 |
| Breteil | 3,678 | €2,430/m² | €23,600 | 76% | 7% | 8.3% | 14% | 37 |
| Bruz | 19,667 | €3,150/m² | €25,250 | 54% | 8% | 9.7% | 15% | 16 |
| Bréal-sous-Montfort | 6,430 | €2,650/m² | €24,290 | 74% | 6% | 5.4% | 5% | 38 |
| Brécé | 2,185 | €2,640/m² | €24,510 | 72% | 3% | 7.5% | 5% | 22 |
| Bédée | 4,571 | €2,490/m² | €24,780 | 73% | 6% | 6.6% | 7% | 34 |
| Cancale | 5,554 | €3,900/m² | €25,380 | 68% | 18% | 8.2% | 21% | 44 |
| Cesson-Sévigné | 18,076 | €3,800/m² | €29,450 | 50% | 11% | 8.4% | 23% | 102 |
| Chantepie | 10,378 | €3,160/m² | €24,870 | 54% | 11% | 10.1% | 21% | 37 |
| Chartres-de-Bretagne | 8,678 | €2,980/m² | €23,890 | 53% | 10% | 10.1% | 10% | 57 |
| Chavagne | 4,562 | €2,740/m² | €24,610 | 67% | 8% | 6.9% | 15% | 39 |
| Chevaigné | 2,396 | €2,810/m² | €26,570 | 73% | 5% | 6.7% | 4% | 20 |
| Châteaubourg | 7,523 | €2,630/m² | €24,830 | 67% | 6% | 5.6% | 13% | 59 |
| Châteaugiron | 10,688 | €2,800/m² | €26,900 | 74% | 6% | 5.6% | 15% | 39 |
| Cintré | 2,614 | €2,480/m² | €24,600 | 82% | 4% | 8.2% | 2% | 23 |
| Combourg | 6,324 | €2,270/m² | €22,720 | 67% | 13% | 8.5% | 27% | 70 |
| Corps-Nuds | 3,555 | €2,440/m² | €23,570 | 70% | 7% | 7.3% | 9% | 25 |
| Crevin | 2,790 | €2,340/m² | €24,190 | 79% | 4% | 4.6% | 8% | 31 |
| Dinard | 10,407 | €5,330/m² | €25,920 | 56% | 23% | 11.0% | 13% | 97 |
| Dol-de-Bretagne | 5,786 | €2,340/m² | €21,700 | 53% | 14% | 10.9% | 3% | 88 |
| Domagné | 2,439 | €2,290/m² | €23,760 | 73% | 5% | 6.5% | 6% | 21 |
| Domalain | 2,050 | €1,870/m² | €22,980 | 77% | 9% | 4.9% | 7% | 18 |
| Domloup | 3,839 | €2,750/m² | €26,730 | 79% | 5% | 3.9% | 12% | 38 |
| Ercé-près-Liffré | 2,010 | €2,420/m² | €25,010 | 78% | 4% | 3.9% | 1% | 18 |
| Fougères | 20,602 | €1,810/m² | €20,620 | 43% | 15% | 14.1% | 13% | 97 |
| Gosné | 2,098 | €2,400/m² | €24,740 | 78% | 6% | 4.7% | 25% | 18 |
| Goven | 4,326 | €2,360/m² | €24,650 | 75% | 8% | 6.4% | 40% | 36 |
| Grand-Fougeray | 2,523 | €1,550/m² | €22,300 | 71% | 11% | 7.4% | 12% | 21 |
| Guichen | 9,203 | €2,590/m² | €25,270 | 72% | 7% | 5.9% | 28% | 36 |
| Guignen | 4,149 | €2,280/m² | €23,440 | 77% | 5% | 7.4% | 20% | 30 |
| Guipry-Messac | 7,243 | €1,820/m² | €22,370 | 76% | 8% | 10.2% | 0% | 18 |
| Gévezé | 5,987 | €2,960/m² | €25,190 | 66% | 5% | 6.2% | 8% | 38 |
| Hédé-Bazouges | 2,273 | €2,160/m² | €24,700 | 71% | 8% | 6.0% | 27% | 25 |
| Iffendic | 4,603 | €2,050/m² | €23,340 | 79% | 7% | 5.7% | 13% | 34 |
| Irodouër | 2,308 | €2,090/m² | €23,000 | 78% | 6% | 6.2% | 5% | 18 |
| Janzé | 8,618 | €2,340/m² | €23,450 | 67% | 11% | 6.4% | 0% | 4 |
| Javené | 2,185 | €1,990/m² | €23,730 | 83% | 8% | 4.8% | 3% | 12 |
| L'Hermitage | 4,683 | €2,810/m² | €24,040 | 61% | 9% | 10.6% | 8% | 49 |
| La Bouëxière | 4,602 | €2,300/m² | €24,290 | 76% | 8% | 7.2% | 19% | 36 |
| La Chapelle-Fleurigné | 2,430 | €1,560/m² | €21,660 | 80% | 9% | 4.9% | 40% | 12 |
| La Chapelle-Thouarault | 2,266 | €2,470/m² | €23,720 | 74% | 6% | 9.1% | 9% | 18 |
| La Chapelle-des-Fougeretz | 4,603 | €3,070/m² | €25,490 | 69% | 6% | 9.0% | 3% | 34 |
| La Fresnais | 2,508 | €2,280/m² | €21,560 | 77% | 7% | 8.6% | 1% | 18 |
| La Gouesnière | 2,000 | €2,920/m² | €23,750 | 81% | 5% | 6.7% | 10% | 14 |
| La Guerche-de-Bretagne | 4,450 | €1,550/m² | €21,050 | 61% | 19% | 7.7% | 4% | 39 |
| La Mézière | 4,935 | €2,930/m² | €27,620 | 72% | 4% | 5.8% | 8% | 42 |
| La Richardais | 2,624 | €3,400/m² | €25,390 | 75% | 10% | 9.3% | 1% | 30 |
| Laillé | 5,154 | €2,660/m² | €26,950 | 75% | 7% | 6.1% | 6% | 45 |
| Le Rheu | 9,823 | €2,890/m² | €24,780 | 55% | 6% | 7.4% | 27% | 22 |
| Les Portes du Coglais | 2,235 | €1,410/m² | €21,520 | 74% | 9% | 6.2% | 47% | 8 |
| Liffré | 8,987 | €2,830/m² | €25,650 | 69% | 8% | 6.9% | 56% | 31 |
| Louvigné-du-Désert | 3,352 | €1,320/m² | €20,580 | 72% | 17% | 8.2% | 5% | 37 |
| Lécousse | 3,423 | €2,110/m² | €24,230 | 84% | 10% | 5.8% | 3% | 24 |
| Maen Roch | 5,093 | €1,680/m² | €22,080 | 65% | 12% | 6.7% | 13% | 35 |
| Martigné-Ferchaud | 2,632 | €1,480/m² | €21,020 | 73% | 15% | 11.7% | 2% | 31 |
| Melesse | 7,400 | €3,000/m² | €26,600 | 69% | 9% | 6.2% | 2% | 29 |
| Mesnil-Roc'h | 4,457 | €2,030/m² | €22,370 | 81% | 9% | 6.8% | 21% | 14 |
| Miniac-Morvan | 4,379 | €2,380/m² | €22,330 | 75% | 7% | 8.2% | 16% | 20 |
| Montauban-de-Bretagne | 6,574 | €2,280/m² | €23,640 | 67% | 10% | 6.4% | 9% | 58 |
| Montfort-sur-Meu | 6,767 | €2,440/m² | €24,640 | 65% | 12% | 7.4% | 10% | 54 |
| Montgermont | 3,777 | €3,290/m² | €25,860 | 63% | 9% | 8.5% | 10% | 61 |
| Montreuil-le-Gast | 2,048 | €2,520/m² | €26,530 | 83% | 5% | 4.9% | 7% | 26 |
| Montreuil-sur-Ille | 2,419 | €2,160/m² | €23,020 | 79% | 7% | 5.6% | 12% | 13 |
| Mordelles | 7,831 | €2,870/m² | €23,950 | 61% | 12% | 7.1% | 11% | 0 |
| Nouvoitou | 3,732 | €2,640/m² | €25,160 | 77% | 5% | 5.8% | 1% | 30 |
| Noyal-Châtillon-sur-Seiche | 7,995 | €2,890/m² | €24,960 | 57% | 9% | 8.3% | 19% | 2 |
| Noyal-sur-Vilaine | 6,250 | €2,880/m² | €26,350 | 61% | 9% | 5.8% | 4% | 68 |
| Orgères | 5,602 | €2,730/m² | €24,350 | 68% | 7% | 6.7% | 13% | 42 |
| Pacé | 11,815 | €3,330/m² | €28,450 | 62% | 9% | 8.0% | 33% | 2 |
| Pipriac | 3,871 | €1,710/m² | €21,590 | 71% | 10% | 8.5% | 9% | 28 |
| Piré-Chancé | 3,177 | €2,250/m² | €24,280 | 80% | 5% | 5.3% | 0% | 19 |
| Plerguer | 2,871 | €2,200/m² | €22,450 | 84% | 9% | 5.4% | 11% | 12 |
| Pleugueneuc | 2,063 | €1,890/m² | €21,900 | 79% | 9% | 7.5% | 4% | 22 |
| Pleumeleuc | 3,535 | €2,530/m² | €25,370 | 76% | 5% | 5.5% | 5% | 33 |
| Pleurtuit | 7,064 | €3,060/m² | €23,140 | 64% | 14% | 8.1% | 3% | 42 |
| Pléchâtel | 2,796 | €1,920/m² | €23,260 | 84% | 8% | 7.6% | 43% | 20 |
| Plélan-le-Grand | 4,063 | €2,060/m² | €22,940 | 67% | 12% | 9.3% | 9% | 41 |
| Pont-Péan | 4,289 | €2,760/m² | €25,170 | 68% | 5% | 9.7% | 18% | 42 |
| Redon | 9,336 | €2,040/m² | €21,610 | 52% | 13% | 16.0% | 22% | 77 |
| Rennes | 227,830 | €3,840/m² | €22,770 | 34% | 8% | 14.0% | 17% | 366 |
| Retiers | 4,553 | €1,940/m² | €21,990 | 72% | 13% | 6.6% | 5% | 36 |
| Rives-du-Couesnon | 2,919 | €1,900/m² | €23,170 | 81% | 8% | 4.0% | 0% | 8 |
| Romagné | 2,434 | €1,830/m² | €23,580 | 75% | 7% | 4.2% | 25% | 16 |
| Romillé | 4,154 | €2,470/m² | €24,370 | 73% | 7% | 5.3% | 2% | 28 |
| Saint-Armel | 2,344 | €2,660/m² | €24,090 | 69% | 4% | 8.4% | 6% | 15 |
| Saint-Aubin-d'Aubigné | 4,231 | €2,480/m² | €23,610 | 66% | 8% | 5.4% | 14% | 40 |
| Saint-Aubin-du-Cormier | 4,145 | €2,350/m² | €24,390 | 63% | 8% | 4.8% | 27% | 54 |
| Saint-Briac-sur-Mer | 2,228 | €5,990/m² | €27,560 | 75% | 21% | 14.4% | 5% | 42 |
| Saint-Coulomb | 2,970 | €3,680/m² | €26,740 | 81% | 11% | 6.7% | 1% | 18 |
| Saint-Didier | 2,030 | €2,300/m² | €25,300 | 76% | 5% | 5.6% | 8% | 12 |
| Saint-Domineuc | 2,587 | €2,080/m² | €23,700 | 74% | 10% | 5.2% | 0% | 20 |
| Saint-Erblon | 3,615 | €2,860/m² | €24,550 | 69% | 7% | 9.0% | 24% | 38 |
| Saint-Germain-en-Coglès | 2,091 | €1,640/m² | €22,440 | 75% | 9% | 5.6% | 44% | 16 |
| Saint-Gilles | 5,489 | €2,910/m² | €24,910 | 61% | 8% | 6.0% | 27% | 44 |
| Saint-Grégoire | 9,992 | €3,680/m² | €31,110 | 65% | 8% | 7.9% | 27% | 63 |
| Saint-Jacques-de-la-Lande | 13,593 | €3,070/m² | €21,730 | 47% | 6% | 11.5% | 32% | 96 |
| Saint-Jouan-des-Guérets | 2,816 | €3,580/m² | €24,840 | 70% | 13% | 6.9% | 2% | 29 |
| Saint-Lunaire | 2,647 | €4,950/m² | €27,300 | 78% | 15% | 8.3% | 8% | 47 |
| Saint-Malo | 47,255 | €4,550/m² | €23,490 | 51% | 17% | 11.3% | 7% | 106 |
| Saint-Méen-le-Grand | 4,642 | €1,760/m² | €21,340 | 61% | 16% | 9.5% | 5% | 49 |
| Saint-Méloir-des-Ondes | 4,666 | €3,070/m² | €23,940 | 70% | 8% | 8.1% | 0% | 23 |
| Saint-Père-Marc-en-Poulet | 2,399 | €2,960/m² | €23,920 | 85% | 7% | 6.7% | 5% | 17 |
| Saint-Thurial | 2,165 | €2,220/m² | €24,030 | 85% | 5% | 7.6% | 36% | 11 |
| Sainte-Marie | 2,249 | €1,640/m² | €22,470 | 83% | 12% | 10.8% | 9% | 18 |
| Sens-de-Bretagne | 2,620 | €1,900/m² | €22,670 | 72% | 12% | 7.2% | 20% | 27 |
| Servon-sur-Vilaine | 4,032 | €2,700/m² | €26,130 | 74% | 5% | 6.0% | 8% | 35 |
| Sixt-sur-Aff | 2,222 | €1,590/m² | €21,180 | 78% | 10% | 9.4% | 12% | 14 |
| Talensac | 2,530 | €2,350/m² | €24,770 | 85% | 6% | 4.9% | 16% | 22 |
| Thorigné-Fouillard | 8,631 | €3,210/m² | €28,380 | 69% | 6% | 8.0% | 18% | 30 |
| Tinténiac | 3,877 | €2,390/m² | €23,640 | 66% | 10% | 6.9% | 7% | 53 |
| Val d'Anast | 3,925 | €1,640/m² | €21,890 | 78% | 10% | 10.3% | 13% | 42 |
| Val-Couesnon | 4,084 | €1,270/m² | €21,200 | 73% | 16% | 8.4% | 6% | 19 |
| Val-d'Izé | 2,601 | €1,850/m² | €23,150 | 76% | 8% | 6.2% | 34% | 18 |
| Vern-sur-Seiche | 8,272 | €2,930/m² | €26,480 | 69% | 7% | 7.0% | 24% | 62 |
| Vezin-le-Coquet | 6,441 | €3,110/m² | €24,540 | 59% | 9% | 9.5% | 12% | 74 |
| Vignoc | 2,290 | €2,600/m² | €25,640 | 78% | 3% | 4.8% | 1% | 16 |
| Vitré | 18,892 | €2,570/m² | €23,060 | 54% | 12% | 8.3% | 26% | 80 |
| Étrelles | 2,670 | €2,040/m² | €23,730 | 71% | 8% | 5.2% | 9% | 31 |
Sources: Insee, 2022 population census (sub-municipal files, Open Licence 2.0) · DGFiP property sales (DVF), data.gouv.fr statistics (Open Licence 2.0) · Insee, Filosofi 2021 income data (Open Licence 2.0) · © OpenStreetMap contributors (ODbL)
People.
1,109,232 residents and 505,226 households at the 2022 census, next to the département figure.
Source: Insee, 2022 population census (sub-municipal files, Open Licence 2.0)
Homes.
583,725 homes, 87% of them main residences, with 4.2 rooms on average.
When main homes were built
Source: Insee, 2022 population census (sub-municipal files, Open Licence 2.0)
Property prices.
73,312 house and flat sales over five years.
Median prices from sales published in France’s Demandes de valeurs foncières (DVF) over ten half-years, for sales of a single property. Individual sales are not shown. A median is only given where there were at least ten sales.
Source: DGFiP property sales (DVF), data.gouv.fr statistics (Open Licence 2.0)
Income and work.
Work and qualifications at the 2022 census.
Sources: Insee, 2022 population census (sub-municipal files, Open Licence 2.0)
Health, shops and services.
Facilities and services in Ille-et-Vilaine on 1 January 2025, from Insee’s permanent database of facilities.
Insee’s permanent database of facilities lists the shops, services and health professionals present in each commune on 1 January. Health professionals in private practice are counted one by one; several may work at the same address.
Source: Insee, permanent database of facilities 2025 (Open Licence 2.0)
Natural and industrial hazards.
Share of the département’s 333 communes exposed to each major hazard, and natural-disaster declarations since 1982.
Natural-disaster declarations by type
A natural-disaster declaration (arrêté CatNat) lets insurers pay out for the damage. The count reflects past events, not a forecast of future risk. The list of hazards comes from each département’s major-risk file; a prevention plan in force limits building in exposed zones.
Source: Géorisques, GASPAR database (Open Licence 2.0), as of 5 October 2026