Loire-Atlantique
Loire-Atlantique has 1,473,156 residents in 207 communes. Over five years, homes sold for a median €3,180/m², from €1,250/m² in Rougé to €6,200/m² in La Baule-Escoublac among communes of more than 2,000 people. 61% of households own their main home.
Four maps of Loire-Atlantique.
Each commune is coloured by its value; every map uses the same colour scale, from lowest to highest. Grey: not published.
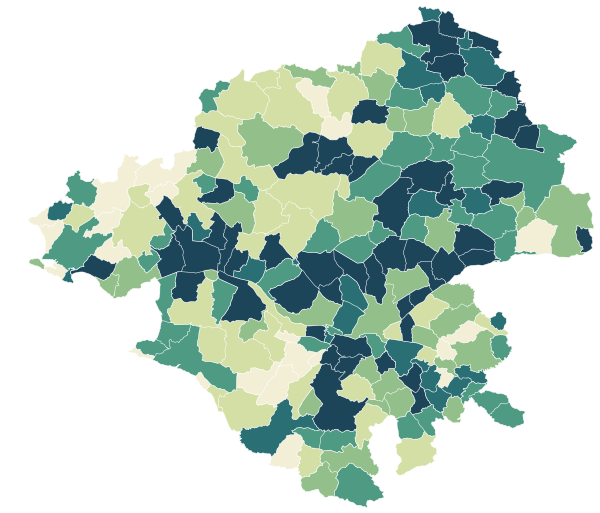
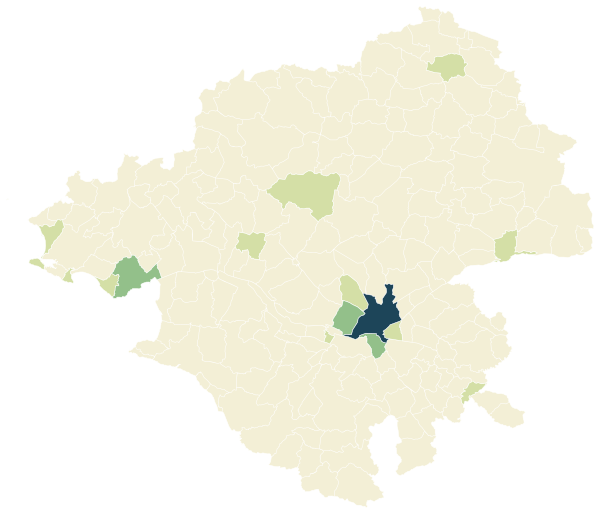
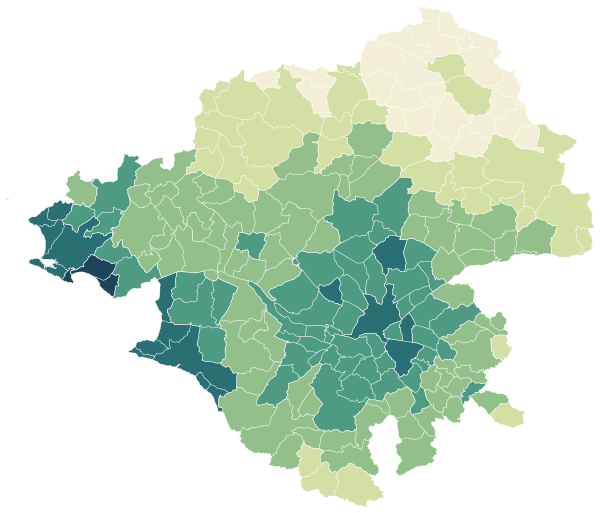
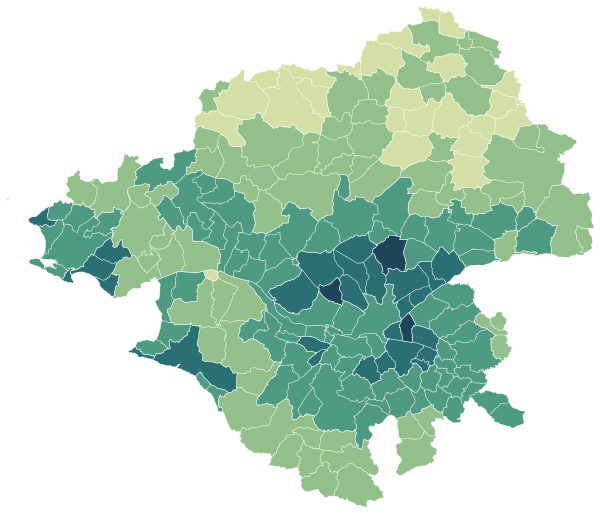
Sources: IGN and Insee, IRIS boundaries and Admin Express 2024 (Open Licence 2.0) · DGFiP property sales (DVF), data.gouv.fr statistics (Open Licence 2.0) · Insee, Filosofi 2021 income data (Open Licence 2.0) · © OpenStreetMap contributors (ODbL)
The 153 communes with more than 2,000 people.
Colour shows where each commune sits among the others in the table, from lowest to highest.
| Commune | Residents | Price per m² | Living standard | Home owners | Aged 75+ | Unemployment | Green 500 m | Services 15 min |
|---|---|---|---|---|---|---|---|---|
| Abbaretz | 2,052 | €1,760/m² | €20,750 | 74% | 7% | 7.1% | 22% | 24 |
| Aigrefeuille-sur-Maine | 4,121 | €2,700/m² | €24,830 | 81% | 7% | 5.5% | 40% | 40 |
| Ancenis-Saint-Géréon | 11,346 | €2,550/m² | €22,740 | 57% | 11% | 9.6% | 19% | 62 |
| Avessac | 2,451 | €1,650/m² | €20,090 | 76% | 10% | 9.8% | 8% | 19 |
| Basse-Goulaine | 9,617 | €3,640/m² | €29,050 | 75% | 9% | 6.5% | 51% | 27 |
| Batz-sur-Mer | 2,799 | €4,760/m² | €23,960 | 74% | 15% | 14.3% | 5% | 46 |
| Besné | 3,317 | €2,310/m² | €24,040 | 83% | 4% | 7.6% | 23% | 18 |
| Blain | 10,352 | €2,220/m² | €22,760 | 69% | 9% | 9.6% | 7% | 77 |
| Bouaye | 8,281 | €3,170/m² | €25,390 | 70% | 7% | 7.3% | 34% | 32 |
| Bouguenais | 20,590 | €3,120/m² | €23,740 | 64% | 8% | 9.3% | 39% | 50 |
| Boussay | 2,814 | €1,990/m² | €23,020 | 84% | 10% | 6.0% | 17% | 21 |
| Bouvron | 3,067 | €2,110/m² | €22,690 | 76% | 10% | 7.4% | 7% | 18 |
| Brains | 2,760 | €2,940/m² | €26,040 | 84% | 5% | 5.0% | 21% | 19 |
| Campbon | 4,031 | €2,390/m² | €23,620 | 81% | 9% | 7.0% | 12% | 28 |
| Carquefou | 20,535 | €3,420/m² | €27,830 | 59% | 8% | 7.3% | 14% | 47 |
| Casson | 2,600 | €2,820/m² | €25,080 | 84% | 3% | 5.7% | 16% | 19 |
| Chaumes-en-Retz | 7,288 | €2,670/m² | €22,750 | 75% | 8% | 7.5% | 8% | 27 |
| Chauvé | 3,035 | €2,740/m² | €22,680 | 80% | 6% | 5.8% | 7% | 18 |
| Château-Thébaud | 3,138 | €2,770/m² | €25,370 | 80% | 6% | 5.3% | 31% | 33 |
| Châteaubriant | 12,231 | €1,810/m² | €20,350 | 58% | 14% | 13.6% | 32% | 60 |
| Clisson | 7,459 | €3,110/m² | €25,170 | 63% | 11% | 7.1% | 20% | 61 |
| Corcoué-sur-Logne | 3,209 | €2,150/m² | €21,980 | 83% | 7% | 5.4% | 13% | 13 |
| Cordemais | 3,954 | €2,640/m² | €24,590 | 82% | 6% | 5.2% | 17% | 28 |
| Corsept | 2,615 | €2,790/m² | €24,200 | 86% | 6% | 7.2% | 97% | 16 |
| Couffé | 2,534 | €2,310/m² | €23,500 | 82% | 4% | 5.2% | 61% | 28 |
| Couëron | 23,541 | €3,170/m² | €24,290 | 66% | 7% | 8.2% | 12% | 39 |
| Crossac | 2,985 | €2,240/m² | €23,370 | 91% | 7% | 5.3% | 35% | 18 |
| Derval | 3,578 | €1,760/m² | €21,380 | 71% | 10% | 7.2% | 8% | 39 |
| Divatte-sur-Loire | 7,158 | €2,640/m² | €24,160 | 78% | 7% | 6.4% | 15% | 9 |
| Donges | 8,117 | €2,160/m² | €22,520 | 76% | 7% | 8.1% | 34% | 20 |
| Drefféac | 2,288 | €2,210/m² | €23,060 | 82% | 5% | 6.3% | 21% | 16 |
| Erbray | 3,062 | €1,530/m² | €22,320 | 83% | 8% | 6.5% | 15% | 22 |
| Fay-de-Bretagne | 3,852 | €2,320/m² | €23,410 | 77% | 6% | 6.5% | 8% | 22 |
| Frossay | 3,289 | €2,500/m² | €22,520 | 82% | 9% | 8.8% | 43% | 13 |
| Fégréac | 2,257 | €1,610/m² | €20,810 | 80% | 11% | 11.7% | 8% | 11 |
| Geneston | 3,691 | €2,620/m² | €24,260 | 81% | 8% | 5.7% | 13% | 25 |
| Gorges | 5,090 | €2,650/m² | €24,310 | 77% | 6% | 5.5% | 26% | 29 |
| Grandchamp-des-Fontaines | 6,910 | €3,130/m² | €26,190 | 81% | 4% | 4.9% | 22% | 28 |
| Guenrouet | 3,577 | €1,840/m² | €21,200 | 83% | 8% | 7.8% | 8% | 22 |
| Guémené-Penfao | 5,242 | €1,510/m² | €20,550 | 74% | 12% | 11.7% | 7% | 17 |
| Guérande | 16,684 | €3,700/m² | €25,270 | 70% | 11% | 8.0% | 18% | 56 |
| Gétigné | 3,794 | €2,450/m² | €23,940 | 81% | 9% | 6.6% | 20% | 40 |
| Haute-Goulaine | 5,992 | €3,310/m² | €27,730 | 77% | 10% | 6.7% | 15% | 27 |
| Herbignac | 7,178 | €2,710/m² | €22,980 | 75% | 8% | 7.6% | 0% | 28 |
| Héric | 6,528 | €2,700/m² | €24,590 | 78% | 6% | 6.9% | 13% | 28 |
| Indre | 4,172 | €3,200/m² | €24,380 | 63% | 5% | 8.7% | 16% | 56 |
| Joué-sur-Erdre | 2,753 | €1,960/m² | €22,510 | 82% | 7% | 5.8% | 36% | 20 |
| La Baule-Escoublac | 16,613 | €6,200/m² | €28,490 | 70% | 22% | 10.9% | 34% | 37 |
| La Bernerie-en-Retz | 3,523 | €4,370/m² | €25,200 | 77% | 19% | 10.9% | 1% | 44 |
| La Chapelle-Heulin | 3,443 | €2,820/m² | €25,180 | 82% | 5% | 4.3% | 2% | 28 |
| La Chapelle-Launay | 3,246 | €2,460/m² | €25,340 | 86% | 5% | 5.3% | 42% | 18 |
| La Chapelle-des-Marais | 4,424 | €2,260/m² | €22,270 | 78% | 9% | 10.6% | 7% | 27 |
| La Chapelle-sur-Erdre | 20,483 | €3,550/m² | €28,210 | 68% | 9% | 8.4% | 37% | 35 |
| La Chevrolière | 6,342 | €2,860/m² | €24,800 | 82% | 7% | 4.9% | 9% | 17 |
| La Haie-Fouassière | 4,734 | €3,030/m² | €26,070 | 79% | 6% | 6.4% | 7% | 27 |
| La Limouzinière | 2,468 | €2,280/m² | €22,820 | 83% | 7% | 5.4% | 16% | 19 |
| La Montagne | 6,523 | €3,060/m² | €24,140 | 74% | 9% | 9.2% | 27% | 70 |
| La Plaine-sur-Mer | 4,617 | €3,900/m² | €23,640 | 78% | 15% | 9.3% | 18% | 35 |
| La Planche | 2,802 | €2,310/m² | €22,990 | 79% | 8% | 4.1% | 15% | 18 |
| La Turballe | 4,862 | €4,160/m² | €25,070 | 73% | 16% | 11.9% | 2% | 66 |
| Le Bignon | 3,967 | €2,910/m² | €25,430 | 81% | 6% | 4.7% | 14% | 24 |
| Le Cellier | 4,011 | €2,570/m² | €26,130 | 80% | 8% | 8.4% | 35% | 29 |
| Le Croisic | 4,081 | €4,370/m² | €25,380 | 72% | 28% | 10.1% | 14% | 87 |
| Le Landreau | 3,214 | €2,500/m² | €23,300 | 77% | 5% | 5.4% | 4% | 21 |
| Le Loroux-Bottereau | 8,595 | €2,900/m² | €24,330 | 70% | 7% | 5.2% | 13% | 53 |
| Le Pallet | 3,374 | €2,540/m² | €24,700 | 80% | 5% | 4.5% | 11% | 20 |
| Le Pellerin | 5,335 | €2,780/m² | €23,370 | 70% | 7% | 8.5% | 7% | 37 |
| Le Pouliguen | 4,007 | €5,200/m² | €25,610 | 69% | 27% | 14.4% | 22% | 90 |
| Le Temple-de-Bretagne | 2,005 | €2,830/m² | €24,610 | 85% | 5% | 4.4% | 23% | 28 |
| Legé | 4,769 | €1,930/m² | €21,560 | 75% | 10% | 6.8% | 17% | 37 |
| Les Sorinières | 9,163 | €3,280/m² | €25,570 | 71% | 8% | 6.7% | 41% | 34 |
| Les Touches | 2,619 | €2,300/m² | €22,380 | 79% | 8% | 6.6% | 22% | 19 |
| Ligné | 5,593 | €2,530/m² | €24,330 | 82% | 6% | 5.6% | 14% | 43 |
| Loireauxence | 7,509 | €1,810/m² | €21,590 | 74% | 10% | 9.2% | 10% | 47 |
| Machecoul-Saint-Même | 7,665 | €2,370/m² | €22,310 | 71% | 12% | 7.7% | 29% | 2 |
| Maisdon-sur-Sèvre | 3,071 | €2,630/m² | €23,710 | 80% | 5% | 4.1% | 23% | 15 |
| Malville | 3,689 | €2,650/m² | €25,080 | 78% | 4% | 5.5% | 31% | 17 |
| Mauves-sur-Loire | 3,393 | €2,860/m² | €25,880 | 79% | 7% | 6.3% | 32% | 29 |
| Mesquer | 2,156 | €3,970/m² | €25,260 | 80% | 15% | 15.6% | 29% | 35 |
| Missillac | 5,619 | €2,260/m² | €23,070 | 83% | 9% | 5.7% | 3% | 25 |
| Monnières | 2,341 | €2,590/m² | €24,520 | 80% | 5% | 6.2% | 2% | 16 |
| Montbert | 3,346 | €2,620/m² | €23,920 | 84% | 7% | 3.9% | 11% | 24 |
| Montoir-de-Bretagne | 7,289 | €2,450/m² | €22,090 | 65% | 9% | 8.4% | 31% | 24 |
| Mouzeil | 2,004 | €2,130/m² | €23,020 | 84% | 3% | 6.8% | 19% | 14 |
| Mouzillon | 2,903 | €2,560/m² | €24,130 | 75% | 6% | 6.3% | 28% | 21 |
| Mésanger | 4,681 | €2,360/m² | €23,300 | 78% | 6% | 5.0% | 19% | 24 |
| Nantes | 325,070 | €3,750/m² | €24,170 | 36% | 7% | 13.3% | 11% | 333 |
| Nort-sur-Erdre | 9,448 | €2,780/m² | €23,710 | 70% | 9% | 5.9% | 32% | 46 |
| Notre-Dame-des-Landes | 2,335 | €2,410/m² | €23,330 | 80% | 5% | 6.3% | 18% | 19 |
| Nozay | 4,280 | €2,050/m² | €21,890 | 66% | 11% | 9.0% | 6% | 51 |
| Orvault | 28,341 | €3,380/m² | €27,140 | 66% | 11% | 8.9% | 29% | 96 |
| Oudon | 3,915 | €2,510/m² | €25,460 | 82% | 8% | 5.9% | 31% | 41 |
| Paimbœuf | 3,030 | €2,050/m² | €20,790 | 58% | 12% | 12.0% | 11% | 28 |
| Paulx | 2,042 | €2,070/m² | €22,270 | 81% | 6% | 6.9% | 2% | 19 |
| Petit-Mars | 3,865 | €2,620/m² | €24,560 | 81% | 4% | 5.6% | 16% | 25 |
| Piriac-sur-Mer | 2,663 | €4,320/m² | €26,140 | 78% | 20% | 12.7% | 0% | 45 |
| Plessé | 5,281 | €1,770/m² | €21,800 | 78% | 9% | 10.9% | 14% | 35 |
| Pont-Saint-Martin | 6,942 | €3,120/m² | €25,530 | 78% | 8% | 4.9% | 10% | 37 |
| Pontchâteau | 11,249 | €2,350/m² | €23,340 | 71% | 9% | 8.5% | 9% | 36 |
| Pornic | 18,382 | €4,670/m² | €26,200 | 70% | 16% | 9.6% | 20% | 28 |
| Pornichet | 12,530 | €5,700/m² | €27,460 | 68% | 18% | 10.7% | 12% | 70 |
| Port-Saint-Père | 3,046 | €2,760/m² | €24,890 | 76% | 6% | 6.1% | 3% | 24 |
| Prinquiau | 3,557 | €2,410/m² | €24,440 | 85% | 6% | 4.9% | 35% | 16 |
| Rezé | 43,349 | €3,130/m² | €23,550 | 58% | 10% | 10.0% | 21% | 129 |
| Riaillé | 2,358 | €1,690/m² | €20,690 | 73% | 8% | 7.1% | 21% | 40 |
| Rouans | 3,272 | €2,530/m² | €23,910 | 84% | 7% | 4.7% | 5% | 20 |
| Rougé | 2,152 | €1,250/m² | €21,460 | 82% | 12% | 8.6% | 52% | 28 |
| Saffré | 4,075 | €2,150/m² | €22,720 | 81% | 6% | 5.0% | 16% | 28 |
| Saint-Aignan-Grandlieu | 3,991 | €2,840/m² | €25,410 | 83% | 7% | 5.3% | 43% | 30 |
| Saint-André-des-Eaux | 6,949 | €3,370/m² | €26,240 | 80% | 8% | 6.0% | 0% | 21 |
| Saint-Brevin-les-Pins | 14,645 | €3,990/m² | €25,290 | 71% | 14% | 8.7% | 22% | 21 |
| Saint-Colomban | 3,499 | €2,430/m² | €23,240 | 78% | 4% | 6.8% | 9% | 25 |
| Saint-Gildas-des-Bois | 3,790 | €1,880/m² | €22,320 | 76% | 12% | 9.8% | 12% | 33 |
| Saint-Herblain | 50,561 | €2,930/m² | €23,000 | 54% | 9% | 11.3% | 24% | 112 |
| Saint-Hilaire-de-Chaléons | 2,376 | €2,500/m² | €22,760 | 79% | 9% | 6.9% | 3% | 21 |
| Saint-Hilaire-de-Clisson | 2,405 | €2,420/m² | €23,830 | 82% | 4% | 5.3% | 14% | 19 |
| Saint-Jean-de-Boiseau | 6,024 | €3,050/m² | €24,230 | 76% | 9% | 7.5% | 49% | 16 |
| Saint-Joachim | 4,125 | €2,050/m² | €22,060 | 79% | 11% | 7.0% | 6% | 17 |
| Saint-Julien-de-Concelles | 7,768 | €3,000/m² | €25,110 | 81% | 8% | 5.3% | 6% | 16 |
| Saint-Lumine-de-Clisson | 2,118 | €2,290/m² | €23,200 | 80% | 5% | 4.2% | 25% | 17 |
| Saint-Lumine-de-Coutais | 2,390 | €2,440/m² | €23,030 | 82% | 5% | 6.4% | 13% | 15 |
| Saint-Lyphard | 5,246 | €2,810/m² | €24,360 | 82% | 8% | 6.1% | 0% | 17 |
| Saint-Léger-les-Vignes | 2,114 | €2,920/m² | €25,730 | 78% | 5% | 4.8% | 2% | 21 |
| Saint-Malo-de-Guersac | 3,221 | €2,330/m² | €22,730 | 86% | 8% | 8.5% | 16% | 19 |
| Saint-Mars-de-Coutais | 2,644 | €2,580/m² | €24,010 | 81% | 8% | 7.8% | 6% | 16 |
| Saint-Mars-du-Désert | 5,435 | €2,810/m² | €24,830 | 84% | 4% | 5.8% | 34% | 32 |
| Saint-Michel-Chef-Chef | 5,520 | €4,100/m² | €24,210 | 74% | 15% | 8.5% | 20% | 34 |
| Saint-Molf | 2,859 | €3,110/m² | €23,370 | 80% | 6% | 6.7% | 8% | 28 |
| Saint-Nazaire | 73,111 | €2,930/m² | €21,900 | 48% | 12% | 13.7% | 14% | 116 |
| Saint-Nicolas-de-Redon | 3,304 | €1,890/m² | €21,510 | 72% | 11% | 13.8% | 20% | 17 |
| Saint-Philbert-de-Grand-Lieu | 9,392 | €2,770/m² | €24,430 | 75% | 7% | 6.2% | 67% | 32 |
| Saint-Père-en-Retz | 4,701 | €2,800/m² | €22,290 | 73% | 8% | 9.3% | 9% | 36 |
| Saint-Sébastien-sur-Loire | 28,373 | €3,480/m² | €25,500 | 59% | 10% | 9.0% | 7% | 87 |
| Saint-Viaud | 2,846 | €2,740/m² | €22,650 | 79% | 7% | 5.5% | 17% | 27 |
| Saint-Étienne-de-Montluc | 7,739 | €3,040/m² | €26,740 | 77% | 7% | 6.1% | 51% | 2 |
| Sainte-Anne-sur-Brivet | 3,014 | €2,270/m² | €23,260 | 84% | 6% | 7.5% | 34% | 20 |
| Sainte-Luce-sur-Loire | 16,227 | €3,440/m² | €25,940 | 61% | 7% | 8.7% | 33% | 53 |
| Sainte-Pazanne | 7,209 | €2,850/m² | €23,860 | 75% | 7% | 6.3% | 2% | 49 |
| Sainte-Reine-de-Bretagne | 2,447 | €2,160/m² | €22,050 | 83% | 10% | 8.5% | 2% | 20 |
| Sautron | 8,534 | €3,680/m² | €29,660 | 67% | 13% | 6.0% | 34% | 44 |
| Savenay | 9,465 | €2,810/m² | €24,840 | 66% | 8% | 8.3% | 9% | 79 |
| Sucé-sur-Erdre | 7,457 | €3,620/m² | €30,100 | 83% | 9% | 5.4% | 39% | 5 |
| Thouaré-sur-Loire | 10,956 | €3,380/m² | €26,560 | 63% | 8% | 7.5% | 50% | 30 |
| Treillières | 10,414 | €3,220/m² | €27,760 | 78% | 7% | 4.9% | 35% | 25 |
| Trignac | 8,234 | €2,480/m² | €21,210 | 67% | 9% | 11.9% | 20% | 46 |
| Vair-sur-Loire | 4,890 | €2,060/m² | €23,100 | 81% | 6% | 6.8% | 5% | 22 |
| Vallet | 9,524 | €2,640/m² | €24,190 | 69% | 7% | 5.8% | 14% | 27 |
| Vallons-de-l'Erdre | 6,625 | €1,510/m² | €21,420 | 74% | 9% | 6.5% | 21% | 36 |
| Vay | 2,084 | €1,770/m² | €21,630 | 79% | 5% | 6.0% | 46% | 11 |
| Vertou | 26,048 | €3,610/m² | €27,590 | 71% | 10% | 6.7% | 26% | 39 |
| Vieillevigne | 4,110 | €2,170/m² | €22,650 | 82% | 9% | 4.5% | 7% | 30 |
| Vigneux-de-Bretagne | 6,633 | €3,030/m² | €28,250 | 85% | 6% | 4.6% | 41% | 7 |
| Villeneuve-en-Retz | 5,004 | €2,430/m² | €22,550 | 80% | 12% | 8.5% | 9% | 25 |
Sources: Insee, 2022 population census (sub-municipal files, Open Licence 2.0) · DGFiP property sales (DVF), data.gouv.fr statistics (Open Licence 2.0) · Insee, Filosofi 2021 income data (Open Licence 2.0) · © OpenStreetMap contributors (ODbL)
People.
1,473,156 residents and 675,078 households at the 2022 census, next to the département figure.
Source: Insee, 2022 population census (sub-municipal files, Open Licence 2.0)
Homes.
799,354 homes, 84% of them main residences, with 4.1 rooms on average.
When main homes were built
Source: Insee, 2022 population census (sub-municipal files, Open Licence 2.0)
Property prices.
103,702 house and flat sales over five years.
Median prices from sales published in France’s Demandes de valeurs foncières (DVF) over ten half-years, for sales of a single property. Individual sales are not shown. A median is only given where there were at least ten sales.
Source: DGFiP property sales (DVF), data.gouv.fr statistics (Open Licence 2.0)
Income and work.
Work and qualifications at the 2022 census.
Sources: Insee, 2022 population census (sub-municipal files, Open Licence 2.0)
Health, shops and services.
Facilities and services in Loire-Atlantique on 1 January 2025, from Insee’s permanent database of facilities.
Insee’s permanent database of facilities lists the shops, services and health professionals present in each commune on 1 January. Health professionals in private practice are counted one by one; several may work at the same address.
Source: Insee, permanent database of facilities 2025 (Open Licence 2.0)
Natural and industrial hazards.
Share of the département’s 207 communes exposed to each major hazard, and natural-disaster declarations since 1982.
Natural-disaster declarations by type
A natural-disaster declaration (arrêté CatNat) lets insurers pay out for the damage. The count reflects past events, not a forecast of future risk. The list of hazards comes from each département’s major-risk file; a prevention plan in force limits building in exposed zones.
Source: Géorisques, GASPAR database (Open Licence 2.0), as of 5 October 2026
Every commune.
Every commune has its own page.