Haute-Garonne
Haute-Garonne has 1,456,261 residents in 586 communes. Over five years, homes sold for a median €2,870/m², from €1,050/m² in Montréjeau to €3,570/m² in Quint-Fonsegrives among communes of more than 2,000 people. 52% of households own their main home.
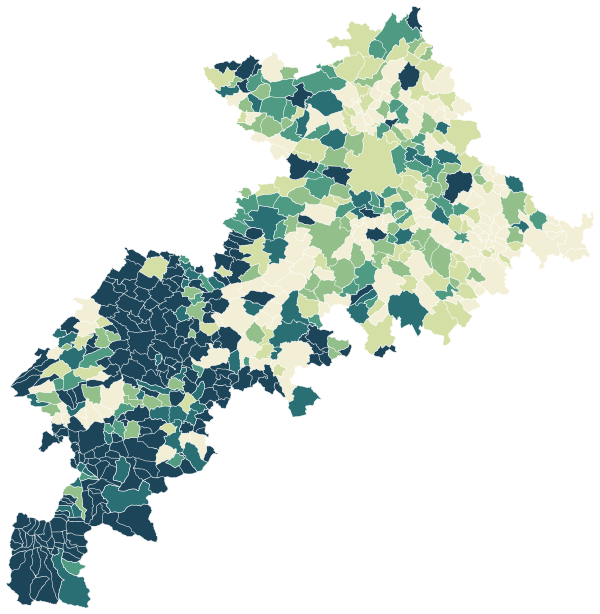
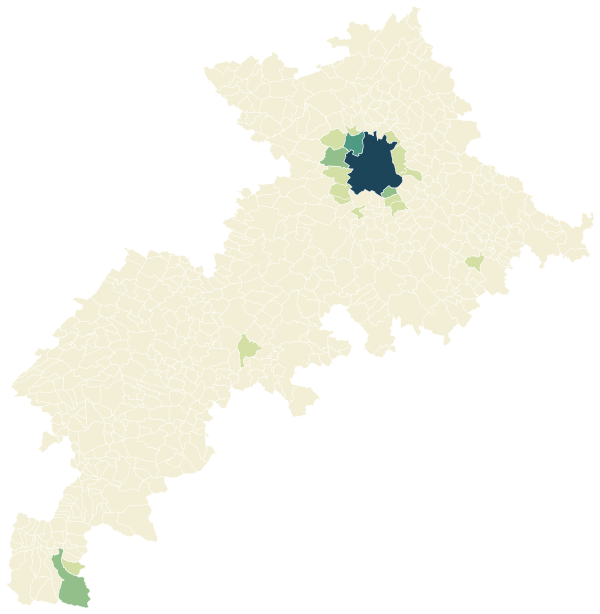
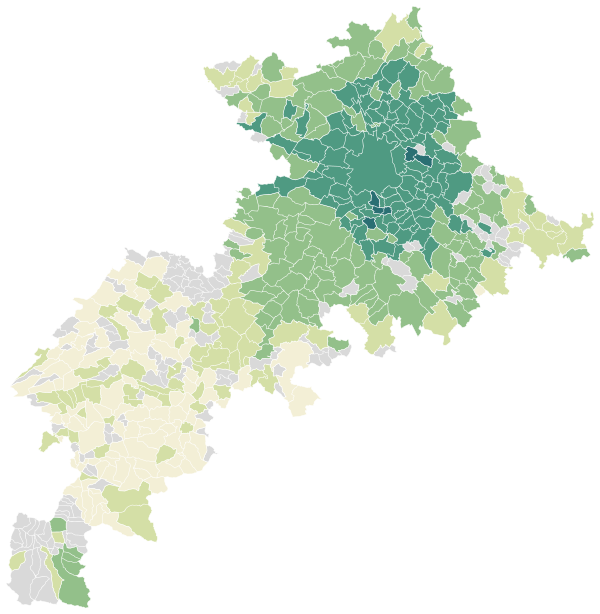
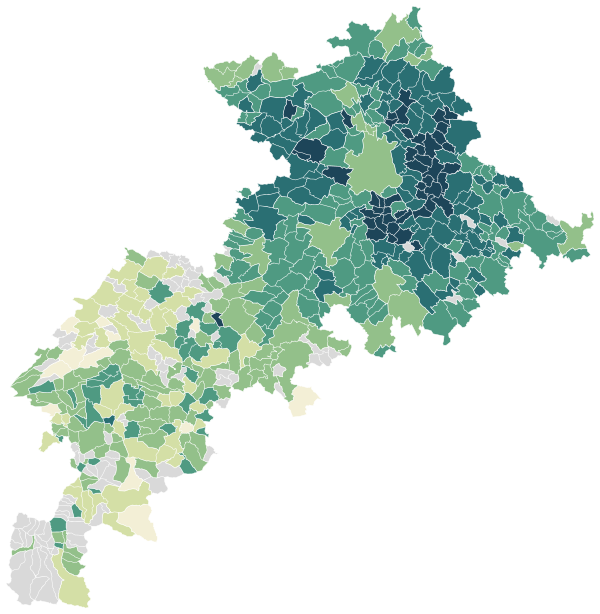
Four maps of Haute-Garonne.
Each commune is coloured by its value; every map uses the same colour scale, from lowest to highest. Grey: not published.
Sources: IGN and Insee, IRIS boundaries and Admin Express 2024 (Open Licence 2.0) · DGFiP property sales (DVF), data.gouv.fr statistics (Open Licence 2.0) · Insee, Filosofi 2021 income data (Open Licence 2.0) · © OpenStreetMap contributors (ODbL)
The 114 communes with more than 2,000 people.
Colour shows where each commune sits among the others in the table, from lowest to highest.
| Commune | Residents | Price per m² | Living standard | Home owners | Aged 75+ | Unemployment | Green 500 m | Services 15 min |
|---|---|---|---|---|---|---|---|---|
| Aucamville | 9,578 | €2,740/m² | €22,860 | 51% | 7% | 11.2% | 1% | 58 |
| Aussonne | 7,731 | €2,850/m² | €26,070 | 64% | 8% | 8.2% | 1% | 47 |
| Auterive | 10,291 | €2,020/m² | €22,080 | 60% | 11% | 11.2% | 4% | 8 |
| Auzeville-Tolosane | 4,451 | €3,190/m² | €29,070 | 40% | 8% | 11.1% | 5% | 64 |
| Ayguesvives | 2,807 | €2,750/m² | €28,200 | 81% | 6% | 5.3% | 10% | 23 |
| Bagnères-de-Luchon | 2,081 | €2,250/m² | €20,320 | 50% | 22% | 11.5% | 23% | 103 |
| Balma | 17,431 | €3,560/m² | €28,580 | 57% | 11% | 9.3% | 17% | 85 |
| Baziège | 3,590 | €2,600/m² | €25,570 | 72% | 9% | 5.6% | 0% | 27 |
| Beauzelle | 8,184 | €3,060/m² | €24,650 | 50% | 8% | 8.5% | 9% | 82 |
| Bessières | 4,238 | €2,290/m² | €23,110 | 66% | 12% | 9.0% | 8% | 21 |
| Blagnac | 27,314 | €3,170/m² | €25,350 | 46% | 8% | 11.0% | 12% | 150 |
| Bouloc | 4,655 | €2,650/m² | €27,260 | 78% | 7% | 6.4% | 8% | 37 |
| Brax | 2,938 | €3,010/m² | €30,110 | 75% | 7% | 7.2% | 9% | 21 |
| Bruguières | 5,908 | €2,800/m² | €25,540 | 60% | 8% | 9.2% | 7% | 47 |
| Buzet-sur-Tarn | 2,847 | €2,440/m² | €25,560 | 78% | 6% | 8.8% | 1% | 9 |
| Bérat | 3,079 | €2,320/m² | €23,880 | 79% | 6% | 7.5% | 1% | 21 |
| Calmont | 2,442 | €1,960/m² | €23,560 | 79% | 11% | 7.2% | 9% | 13 |
| Caraman | 2,487 | €2,350/m² | €24,710 | 65% | 9% | 7.4% | 4% | 31 |
| Carbonne | 5,650 | €2,170/m² | €22,590 | 64% | 12% | 10.1% | 25% | 59 |
| Castanet-Tolosan | 15,264 | €3,200/m² | €25,080 | 45% | 9% | 9.5% | 21% | 88 |
| Castelginest | 11,033 | €2,840/m² | €23,790 | 57% | 10% | 10.2% | 1% | 49 |
| Castelmaurou | 4,491 | €3,290/m² | €28,780 | 77% | 10% | 5.9% | 2% | 20 |
| Castelnau-d'Estrétefonds | 6,915 | €2,530/m² | €24,980 | 66% | 5% | 7.6% | 8% | 29 |
| Cazères | 4,818 | €1,700/m² | €20,080 | 54% | 13% | 16.8% | 5% | 81 |
| Cintegabelle | 2,994 | €2,060/m² | €22,210 | 75% | 9% | 9.8% | 27% | 35 |
| Colomiers | 40,916 | €2,740/m² | €23,690 | 48% | 8% | 12.6% | 14% | 113 |
| Cornebarrieu | 8,571 | €2,830/m² | €25,600 | 52% | 6% | 7.4% | 24% | 84 |
| Cugnaux | 20,239 | €2,720/m² | €23,980 | 51% | 9% | 12.3% | 14% | 89 |
| Cépet | 2,325 | €2,670/m² | €25,370 | 70% | 11% | 7.3% | 0% | 12 |
| Daux | 2,575 | €2,610/m² | €27,000 | 73% | 5% | 6.0% | 3% | 12 |
| Drémil-Lafage | 2,622 | €3,200/m² | €30,000 | 84% | 6% | 7.8% | 15% | 10 |
| Eaunes | 6,525 | €2,520/m² | €24,230 | 65% | 8% | 8.9% | 0% | 14 |
| Escalquens | 6,990 | €3,180/m² | €27,790 | 64% | 10% | 8.5% | 2% | 46 |
| Fenouillet | 5,727 | €2,550/m² | €22,940 | 58% | 7% | 8.4% | 1% | 35 |
| Flourens | 2,073 | €3,360/m² | €29,110 | 77% | 9% | 7.0% | 16% | 17 |
| Fonbeauzard | 3,086 | €2,680/m² | €23,240 | 53% | 8% | 10.1% | 8% | 51 |
| Fonsorbes | 13,048 | €2,690/m² | €25,650 | 71% | 6% | 8.1% | 11% | 29 |
| Fontenilles | 5,869 | €2,770/m² | €27,860 | 79% | 5% | 6.4% | 9% | 23 |
| Fronton | 6,664 | €2,510/m² | €24,760 | 69% | 9% | 7.4% | 5% | 44 |
| Frouzins | 9,808 | €2,750/m² | €25,080 | 66% | 9% | 9.5% | 6% | 37 |
| Gagnac-sur-Garonne | 3,223 | €2,620/m² | €25,090 | 66% | 8% | 5.8% | 5% | 21 |
| Gragnague | 2,428 | €3,030/m² | €28,720 | 82% | 6% | 5.0% | 15% | 17 |
| Gratentour | 4,926 | €2,880/m² | €25,020 | 66% | 7% | 9.0% | 0% | 19 |
| Grenade | 9,039 | €2,350/m² | €23,810 | 58% | 9% | 9.5% | 18% | 3 |
| L'Union | 12,410 | €3,300/m² | €27,930 | 70% | 19% | 8.9% | 7% | 82 |
| La Salvetat-Saint-Gilles | 8,477 | €2,820/m² | €26,820 | 69% | 5% | 8.9% | 21% | 26 |
| Labarthe-sur-Lèze | 6,467 | €2,780/m² | €24,260 | 69% | 8% | 8.2% | 1% | 32 |
| Labastidette | 2,946 | €2,470/m² | €24,760 | 76% | 4% | 7.6% | 0% | 14 |
| Labège | 4,316 | €3,390/m² | €26,350 | 36% | 9% | 10.9% | 10% | 45 |
| Lacroix-Falgarde | 2,047 | €3,230/m² | €31,270 | 76% | 12% | 5.0% | 34% | 28 |
| Lagardelle-sur-Lèze | 3,304 | €2,660/m² | €24,980 | 82% | 7% | 6.7% | 11% | 24 |
| Lanta | 2,269 | €2,780/m² | €27,130 | 76% | 6% | 6.0% | 32% | 21 |
| Lapeyrouse-Fossat | 2,983 | €3,170/m² | €30,580 | 86% | 7% | 6.2% | 19% | 21 |
| Larra | 2,249 | €2,490/m² | €26,190 | 86% | 5% | 5.9% | 37% | 13 |
| Launaguet | 9,216 | €2,710/m² | €23,290 | 52% | 7% | 8.8% | 17% | 33 |
| Lavernose-Lacasse | 3,665 | €2,460/m² | €24,630 | 75% | 7% | 10.0% | 5% | 30 |
| Le Fauga | 2,509 | €2,410/m² | €24,080 | 77% | 6% | 8.1% | 6% | 14 |
| Lespinasse | 3,032 | €2,780/m² | €24,570 | 71% | 5% | 9.9% | 1% | 22 |
| Lherm | 3,849 | €2,480/m² | €25,030 | 81% | 9% | 7.8% | 1% | 24 |
| Longages | 3,336 | €2,270/m² | €23,810 | 71% | 7% | 8.2% | 0% | 18 |
| Léguevin | 9,710 | €2,600/m² | €26,280 | 63% | 6% | 7.5% | 30% | 11 |
| Lévignac | 2,206 | €2,660/m² | €27,650 | 78% | 8% | 5.6% | 22% | 27 |
| Martres-Tolosane | 2,388 | €1,610/m² | €20,830 | 62% | 14% | 13.4% | 2% | 48 |
| Merville | 6,640 | €2,470/m² | €24,450 | 67% | 5% | 8.4% | 27% | 23 |
| Miremont | 2,787 | €2,350/m² | €24,160 | 80% | 6% | 7.4% | 20% | 34 |
| Mondonville | 6,003 | €2,650/m² | €23,920 | 50% | 5% | 9.8% | 16% | 26 |
| Montastruc-la-Conseillère | 3,719 | €2,840/m² | €27,630 | 75% | 9% | 8.2% | 0% | 30 |
| Montberon | 3,121 | €2,930/m² | €27,790 | 81% | 7% | 5.8% | 18% | 15 |
| Montesquieu-Volvestre | 3,083 | €1,480/m² | €21,660 | 66% | 13% | 8.8% | 0% | 24 |
| Montgiscard | 2,586 | €2,760/m² | €27,200 | 78% | 9% | 5.3% | 13% | 18 |
| Montrabé | 4,322 | €3,130/m² | €28,350 | 64% | 9% | 7.5% | 13% | 38 |
| Montréjeau | 2,676 | €1,050/m² | €18,150 | 50% | 19% | 20.6% | 13% | 46 |
| Muret | 25,653 | €2,340/m² | €22,450 | 52% | 10% | 13.1% | 13% | 48 |
| Nailloux | 4,146 | €1,860/m² | €24,210 | 57% | 7% | 8.5% | 8% | 45 |
| Noé | 2,979 | €2,330/m² | €23,270 | 75% | 8% | 12.2% | 13% | 23 |
| Pechbonnieu | 4,792 | €2,870/m² | €26,860 | 72% | 8% | 7.3% | 11% | 50 |
| Pibrac | 8,828 | €3,110/m² | €30,690 | 72% | 9% | 6.9% | 9% | 33 |
| Pins-Justaret | 4,377 | €2,740/m² | €24,970 | 69% | 9% | 9.3% | 0% | 26 |
| Pinsaguel | 2,779 | €2,750/m² | €25,680 | 71% | 12% | 10.0% | 24% | 64 |
| Plaisance-du-Touch | 20,471 | €2,940/m² | €26,170 | 65% | 8% | 7.8% | 16% | 41 |
| Pompertuzat | 2,203 | €3,170/m² | €29,690 | 80% | 6% | 4.7% | 15% | 18 |
| Portet-sur-Garonne | 9,798 | €2,830/m² | €23,030 | 61% | 11% | 12.2% | 27% | 53 |
| Péchabou | 2,465 | €3,130/m² | €29,830 | 75% | 5% | 6.5% | 12% | 25 |
| Quint-Fonsegrives | 6,059 | €3,570/m² | €28,470 | 63% | 15% | 7.0% | 10% | 79 |
| Ramonville-Saint-Agne | 15,172 | €3,030/m² | €24,600 | 47% | 10% | 13.8% | 22% | 124 |
| Revel | 9,686 | €1,910/m² | €21,290 | 54% | 17% | 16.3% | 0% | 30 |
| Rieumes | 3,564 | €1,930/m² | €22,690 | 63% | 12% | 9.1% | 7% | 32 |
| Rieux-Volvestre | 2,625 | €1,920/m² | €22,530 | 73% | 11% | 9.7% | 23% | 31 |
| Roques | 5,295 | €2,810/m² | €24,430 | 67% | 7% | 11.1% | 21% | 51 |
| Roquettes | 4,292 | €2,690/m² | €25,830 | 68% | 9% | 8.5% | 8% | 23 |
| Rouffiac-Tolosan | 2,186 | €2,890/m² | €32,540 | 72% | 12% | 7.0% | 10% | 32 |
| Saint-Alban | 6,447 | €2,750/m² | €23,010 | 58% | 9% | 9.8% | 2% | 39 |
| Saint-Gaudens | 11,869 | €1,250/m² | €19,530 | 48% | 17% | 16.7% | 5% | 55 |
| Saint-Geniès-Bellevue | 2,492 | €2,910/m² | €29,330 | 70% | 11% | 7.2% | 30% | 27 |
| Saint-Jean | 11,239 | €3,120/m² | €25,940 | 64% | 12% | 8.4% | 13% | 42 |
| Saint-Jory | 7,996 | €2,840/m² | €22,560 | 41% | 4% | 11.3% | 3% | 35 |
| Saint-Loup-Cammas | 2,343 | €3,340/m² | €29,020 | 82% | 5% | 7.3% | 4% | 20 |
| Saint-Lys | 9,776 | €2,480/m² | €24,340 | 67% | 9% | 9.3% | 17% | 46 |
| Saint-Orens-de-Gameville | 14,229 | €3,190/m² | €26,190 | 59% | 13% | 9.8% | 8% | 47 |
| Saint-Sauveur | 2,235 | €2,760/m² | €24,280 | 69% | 7% | 7.5% | 6% | 13 |
| Saint-Sulpice-sur-Lèze | 2,288 | €2,110/m² | €22,130 | 63% | 10% | 11.5% | 4% | 27 |
| Sainte-Foy-d'Aigrefeuille | 2,512 | €3,380/m² | €30,230 | 84% | 6% | 6.0% | 14% | 13 |
| Sainte-Foy-de-Peyrolières | 2,093 | €2,280/m² | €25,740 | 85% | 9% | 5.2% | 28% | 18 |
| Saubens | 2,351 | €2,860/m² | €28,000 | 78% | 7% | 7.5% | 11% | 14 |
| Seilh | 3,311 | €3,120/m² | €30,250 | 64% | 6% | 5.4% | 8% | 27 |
| Seysses | 10,167 | €2,500/m² | €23,830 | 60% | 7% | 9.7% | 4% | 11 |
| Toulouse | 511,684 | €3,360/m² | €22,140 | 32% | 7% | 14.3% | 7% | 338 |
| Tournefeuille | 29,724 | €3,230/m² | €29,020 | 56% | 9% | 9.5% | 35% | 85 |
| Venerque | 2,898 | €2,800/m² | €26,420 | 77% | 10% | 7.3% | 12% | 48 |
| Verfeil | 3,867 | €2,530/m² | €26,750 | 74% | 7% | 6.0% | 10% | 31 |
| Vernet | 3,294 | €2,730/m² | €25,150 | 77% | 8% | 7.7% | 3% | 49 |
| Villefranche-de-Lauragais | 5,054 | €2,630/m² | €23,580 | 58% | 11% | 9.1% | 2% | 73 |
| Villemur-sur-Tarn | 6,235 | €1,990/m² | €21,150 | 63% | 12% | 12.0% | 16% | 59 |
| Villeneuve-Tolosane | 10,704 | €2,710/m² | €24,100 | 59% | 10% | 9.8% | 8% | 68 |
Sources: Insee, 2022 population census (sub-municipal files, Open Licence 2.0) · DGFiP property sales (DVF), data.gouv.fr statistics (Open Licence 2.0) · Insee, Filosofi 2021 income data (Open Licence 2.0) · © OpenStreetMap contributors (ODbL)
People.
1,456,261 residents and 696,177 households at the 2022 census, next to the département figure.
Source: Insee, 2022 population census (sub-municipal files, Open Licence 2.0)
Homes.
784,337 homes, 89% of them main residences, with 3.8 rooms on average.
When main homes were built
Source: Insee, 2022 population census (sub-municipal files, Open Licence 2.0)
Property prices.
100,041 house and flat sales over five years.
Median prices from sales published in France’s Demandes de valeurs foncières (DVF) over ten half-years, for sales of a single property. Individual sales are not shown. A median is only given where there were at least ten sales.
Source: DGFiP property sales (DVF), data.gouv.fr statistics (Open Licence 2.0)
Income and work.
Work and qualifications at the 2022 census.
Sources: Insee, 2022 population census (sub-municipal files, Open Licence 2.0)
Health, shops and services.
Facilities and services in Haute-Garonne on 1 January 2025, from Insee’s permanent database of facilities.
Insee’s permanent database of facilities lists the shops, services and health professionals present in each commune on 1 January. Health professionals in private practice are counted one by one; several may work at the same address.
Source: Insee, permanent database of facilities 2025 (Open Licence 2.0)
Natural and industrial hazards.
Share of the département’s 586 communes exposed to each major hazard, and natural-disaster declarations since 1982.
Natural-disaster declarations by type
A natural-disaster declaration (arrêté CatNat) lets insurers pay out for the damage. The count reflects past events, not a forecast of future risk. The list of hazards comes from each département’s major-risk file; a prevention plan in force limits building in exposed zones.
Source: Géorisques, GASPAR database (Open Licence 2.0), as of 5 October 2026
Communes.
294 communes in the département have their own page.