City of Edinburgh
City of Edinburgh has 514,024 residents in 238,578 households (Scotland's Census 2022); 24% are aged 15–29 and 39% of households rent their home.
Four maps of City of Edinburgh.
Every dot is a residential postcode. Each map uses the same colour scale, from lowest to highest.
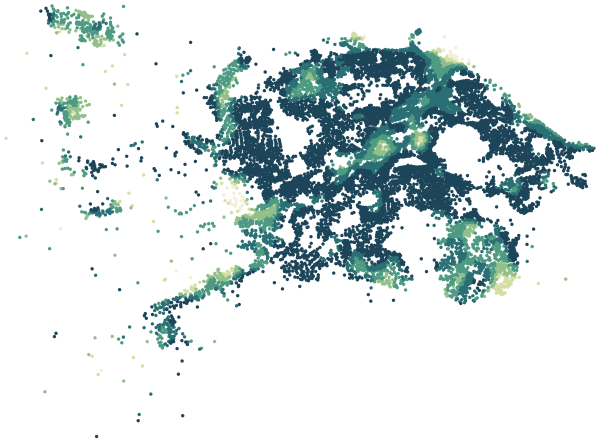
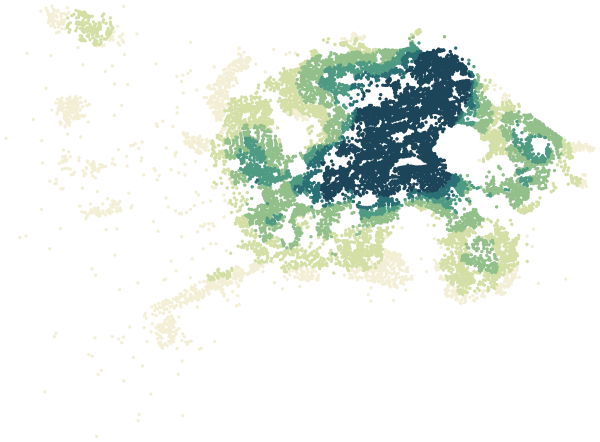
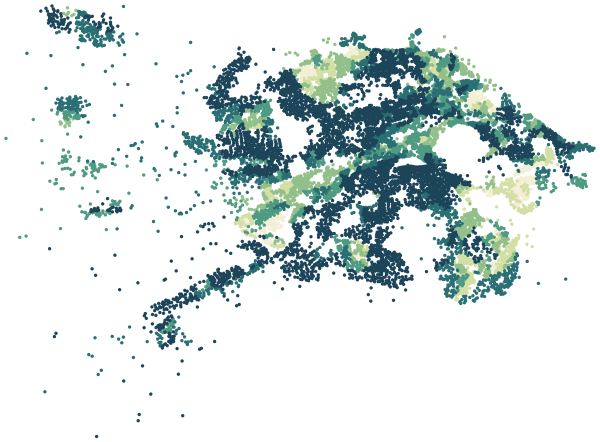
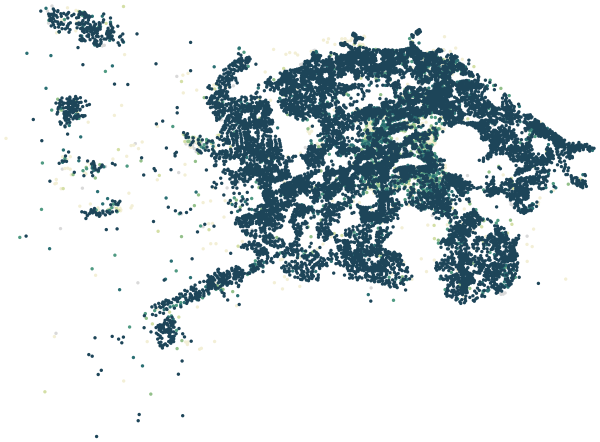
Sources: ONS Postcode Directory, Aug 2026 · HM Land Registry Price Paid Data · © OpenStreetMap contributors · Scottish Index of Multiple Deprivation 2020v2, Scottish Government · Ofcom Connected Nations 2025
All 17 wards at a glance.
Colour shows where each ward sits among City of Edinburgh's wards for that measure, from lowest to highest. Select a ward for its full report.
| Ward | Green 500 m | Services 15 min | Aged 15–29 | Owner-occupied | Flats | Nearest tram or rail | Gigabit |
|---|---|---|---|---|---|---|---|
| Almond | 24% | 49 | 14% | 73% | 30% | 2.7 km | 89% |
| City Centre | 25% | 989 | 49% | 41% | 82% | 427 m | 80% |
| Colinton/Fairmilehead | 33% | 62 | 15% | 76% | 31% | 2.4 km | 96% |
| Corstorphine/Murrayfield | 43% | 143 | 14% | 81% | 44% | 773 m | 97% |
| Craigentinny/Duddingston | 40% | 115 | 21% | 59% | 70% | 2.1 km | 98% |
| Drum Brae/Gyle | 44% | 89 | 15% | 74% | 35% | 1.7 km | 98% |
| Forth | 34% | 140 | 18% | 56% | 72% | 2.3 km | 95% |
| Fountainbridge/Craiglockhart | 35% | 252 | 31% | 59% | 73% | 668 m | 94% |
| Inverleith | 39% | 198 | 18% | 69% | 61% | 1.7 km | 92% |
| Leith | 24% | 324 | 21% | 51% | 83% | 378 m | 91% |
| Leith Walk | 28% | 474 | 32% | 49% | 89% | 513 m | 90% |
| Liberton/Gilmerton | 22% | 83 | 17% | 65% | 31% | 4.0 km | 96% |
| Morningside | 39% | 257 | 30% | 66% | 69% | 1.6 km | 95% |
| Pentland Hills | 22% | 49 | 18% | 62% | 40% | 1.0 km | 92% |
| Portobello/Craigmillar | 34% | 123 | 17% | 60% | 45% | 1.4 km | 97% |
| Sighthill/Gorgie | 28% | 158 | 30% | 45% | 80% | 594 m | 98% |
| Southside/Newington | 37% | 289 | 46% | 54% | 67% | 2.2 km | 82% |
Sources: Scotland's Census 2022 · © OpenStreetMap contributors
Safety.
Police Scotland does not publish street-level crime data on data.police.uk, so City of Edinburgh reports leave out the safety block rather than estimate it.
Road safety.
Injury collisions reported to the police in City of Edinburgh each year, 2021–2025: 748 of them with a serious or fatal injury.
Counts include only collisions involving personal injury that were reported to the police. Most happen on main roads and at junctions, so a count near a postcode reflects the traffic passing through, not the risk of any one journey.
Source: Department for Transport, STATS19 road safety data (Open Government Licence v3.0)
Food hygiene.
Food businesses in City of Edinburgh with a published hygiene rating.
In Scotland, council food safety officers either pass a business or tell it that improvement is required. A result reflects the hygiene standards found on the day of inspection, not the quality of the food.
Source: Food Standards Agency, food hygiene rating data as of 26 October 2026 (Open Government Licence)
Broadband.
Share of homes in City of Edinburgh that can get each type of fixed broadband, July 2025.
Source: Ofcom Connected Nations 2025, fixed broadband coverage of residential premises, July 2025. © Ofcom copyright
Deprivation, in context.
32 of City of Edinburgh's 597 data zones are in the most deprived tenth of Scotland on the 2020v2 index.
The Scottish Index of Multiple Deprivation 2020v2 ranks 6,976 data zones in Scotland from 1 (most deprived 10%) to 10 (least deprived). It is ranked within Scotland only and cannot be compared with the English or Welsh indices. It describes areas, not every household in them.
Source: Scottish Index of Multiple Deprivation 2020v2, Scottish Government
Wards of City of Edinburgh.
Every ward has its own page with all of its postcodes.