East of England
East of England has 6,335,074 residents in 45 local authorities (Census 2021). Homes sold for a median of £349,000 over the past two years, from £222,500 in Great Yarmouth to £620,000 in St Albans.
6,335,074residentsCensus 2021
£349kmedian sale price165,517 sales, 24 months
16%green within 500 mpostcode average
85%gigabit broadbandpremises, Ofcom 2025
East of England by postcode sector
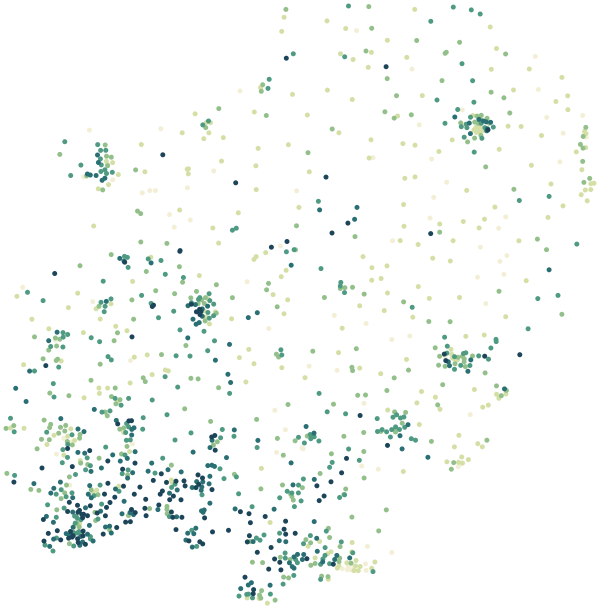
0%30%+
Average share of land within 500 m that is green space, by postcode sector
Map data © OpenStreetMap contributors · ONS Postcode Directory · HM Land Registry · IoD 2025 · Ofcom Connected Nations
Local authorities in East of England.
Every local authority has its own maps, a page for each ward and a report for every postcode. The greenest is Harlow, with 30% of land near homes in green space.
| Local authority | Residents | Median price | Green 500 m | Services 15 min | Gigabit | Crime per 1,000 | Postcodes |
|---|---|---|---|---|---|---|---|
| Central Bedfordshire | 294,252 | £367k | 14% | 42 | 84% | 66 | 6,868 |
| East Suffolk | 246,058 | £287k | 13% | 32 | 83% | 58 | 9,097 |
| Luton | 225,262 | £315k | 12% | 101 | 99% | 98 | 3,231 |
| Peterborough | 215,671 | £245k | 17% | 63 | 96% | 131 | 4,406 |
| Colchester | 192,715 | £325k | 18% | 49 | 83% | 99 | 5,241 |
| Basildon | 187,571 | £363k | 22% | 50 | 92% | 101 | 4,133 |
| Bedford | 185,225 | £350k | 14% | 50 | 86% | 101 | 4,811 |
| Chelmsford | 181,523 | £408k | 21% | 60 | 87% | 88 | 4,373 |
| Huntingdonshire | 180,832 | £323k | 16% | 39 | 91% | 72 | 5,244 |
| Southend-on-Sea | 180,686 | £345k | 8% | 78 | 98% | 118 | 3,640 |
| West Suffolk | 179,948 | £290k | 14% | 38 | 76% | 63 | 5,400 |
| Thurrock | 176,001 | £360k | 19% | 45 | 93% | 104 | 3,282 |
| South Cambridgeshire | 162,118 | £435k | 16% | 32 | 85% | 63 | 4,170 |
| Braintree | 155,268 | £345k | 16% | 23 | 91% | 65 | 4,604 |
| Dacorum | 155,081 | £450k | 18% | 62 | 86% | 89 | 4,032 |
| King's Lynn and West Norfolk | 154,325 | £270k | 10% | 17 | 62% | 67 | 5,126 |
| East Hertfordshire | 150,158 | £450k | 22% | 48 | 84% | 71 | 4,705 |
| Tendring | 148,291 | £284k | 9% | 38 | 77% | 101 | 4,810 |
| St Albans | 148,167 | £620k | 21% | 72 | 94% | 81 | 4,575 |
| Cambridge | 145,674 | £490k | 19% | 169 | 94% | 114 | 2,958 |
| Norwich | 143,922 | £235k | 13% | 137 | 92% | 128 | 3,343 |
| South Norfolk | 141,948 | £300k | 10% | 15 | 69% | 52 | 4,873 |
| Breckland | 141,476 | £268k | 12% | 14 | 66% | 60 | 4,723 |
| Ipswich | 139,642 | £240k | 14% | 94 | 97% | 101 | 3,342 |
| Epping Forest | 134,980 | £515k | 29% | 43 | 90% | 78 | 3,578 |
| North Hertfordshire | 133,210 | £425k | 16% | 56 | 86% | 69 | 3,905 |
| Broadland | 131,721 | £308k | 14% | 21 | 74% | 42 | 4,255 |
| Welwyn Hatfield | 119,836 | £435k | 23% | 65 | 88% | 101 | 3,237 |
| Hertsmere | 107,827 | £545k | 24% | 68 | 90% | 91 | 3,023 |
| North Norfolk | 102,980 | £300k | 10% | 9 | 51% | 52 | 4,556 |
| Mid Suffolk | 102,699 | £315k | 9% | 9 | 58% | 44 | 4,348 |
| Fenland | 102,462 | £235k | 9% | 46 | 88% | 93 | 3,029 |
| Watford | 102,246 | £420k | 17% | 102 | 94% | 116 | 2,460 |
| Great Yarmouth | 99,748 | £223k | 8% | 52 | 86% | 114 | 2,760 |
| Broxbourne | 99,009 | £434k | 21% | 79 | 92% | 97 | 2,443 |
| Three Rivers | 93,771 | £549k | 29% | 53 | 92% | 69 | 2,534 |
| Harlow | 93,329 | £335k | 30% | 97 | 94% | 117 | 1,800 |
| Babergh | 92,341 | £330k | 10% | 14 | 72% | 48 | 3,541 |
| Uttlesford | 91,341 | £465k | 18% | 21 | 83% | 64 | 3,080 |
| Castle Point | 89,587 | £365k | 14% | 29 | 81% | 63 | 2,045 |
| Stevenage | 89,495 | £344k | 19% | 84 | 95% | 122 | 1,940 |
| East Cambridgeshire | 87,762 | £340k | 10% | 24 | 85% | 64 | 2,198 |
| Rochford | 85,661 | £405k | 11% | 28 | 80% | 54 | 2,139 |
| Brentwood | 77,047 | £500k | 26% | 34 | 85% | 76 | 2,159 |
| Maldon | 66,208 | £390k | 15% | 18 | 83% | 53 | 2,026 |
Sources: Census 2021 (ONS) · HM Land Registry Price Paid Data, sales to 28 Aug 2026 · © OpenStreetMap contributors · Ofcom Connected Nations 2025 · data.police.uk