Scotland
Scotland has 5,432,493 residents in 32 council areas (Scotland's Census 2022). House sale prices are not published as open data in Scotland.
5,432,493residentsScotland's Census 2022
32council areas355 wards
22%green within 500 mpostcode average
81%gigabit broadbandpremises, Ofcom 2025
Scotland by postcode sector
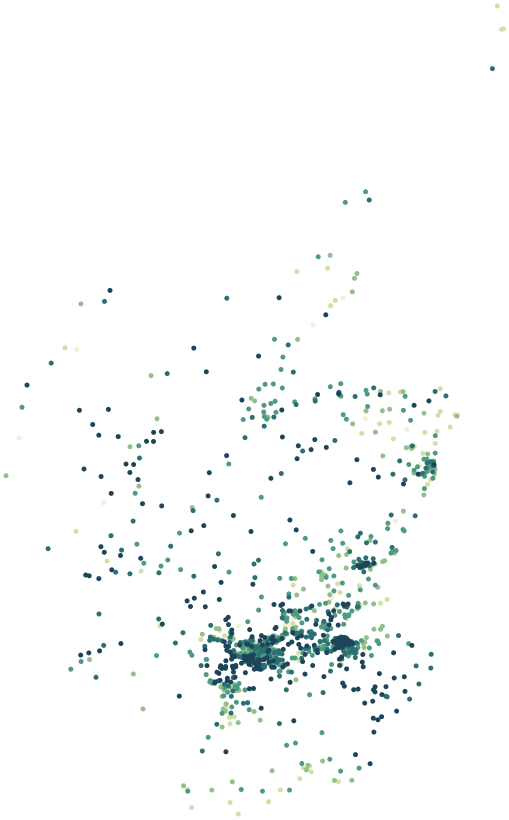
0%30%+
Average share of land within 500 m that is green space, by postcode sector
Map data © OpenStreetMap contributors · ONS Postcode Directory · SIMD 2020v2 · Ofcom Connected Nations
Council areas in Scotland.
Every council area has its own maps, a page for each ward and a report for every postcode. The greenest is Scottish Borders, with 40% of land near homes in green space.
| Council area | Residents | Green 500 m | Services 15 min | Gigabit | Postcodes |
|---|---|---|---|---|---|
| Glasgow City | 615,266 | 19% | 112 | 95% | 15,791 |
| City of Edinburgh | 514,024 | 32% | 132 | 93% | 13,664 |
| Fife | 371,816 | 21% | 49 | 83% | 10,351 |
| North Lanarkshire | 340,248 | 23% | 50 | 94% | 8,019 |
| South Lanarkshire | 327,131 | 26% | 58 | 90% | 8,739 |
| Aberdeenshire | 263,796 | 16% | 11 | 44% | 9,905 |
| Highland | 235,216 | 21% | 24 | 62% | 7,961 |
| Aberdeen City | 223,744 | 17% | 77 | 92% | 6,358 |
| Renfrewshire | 183,839 | 23% | 43 | 96% | 4,755 |
| West Lothian | 181,272 | 24% | 43 | 93% | 4,311 |
| Falkirk | 158,435 | 24% | 57 | 95% | 4,182 |
| Perth and Kinross | 150,923 | 17% | 23 | 54% | 5,528 |
| Dundee City | 148,718 | 29% | 94 | 96% | 4,474 |
| Dumfries and Galloway | 145,858 | 13% | 15 | 54% | 6,926 |
| North Ayrshire | 133,519 | 25% | 33 | 81% | 4,268 |
| East Ayrshire | 120,302 | 20% | 21 | 80% | 4,006 |
| Scottish Borders | 116,827 | 40% | 26 | 69% | 4,530 |
| Angus | 114,284 | 19% | 46 | 60% | 4,033 |
| East Lothian | 112,280 | 17% | 58 | 87% | 3,311 |
| South Ayrshire | 111,532 | 15% | 41 | 81% | 3,602 |
| East Dunbartonshire | 108,955 | 21% | 68 | 93% | 3,275 |
| East Renfrewshire | 96,825 | 30% | 73 | 95% | 2,533 |
| Midlothian | 96,353 | 24% | 50 | 92% | 3,076 |
| Moray | 93,091 | 20% | 24 | 61% | 3,402 |
| Stirling | 92,606 | 23% | 40 | 76% | 2,939 |
| West Dunbartonshire | 88,398 | 18% | 59 | 94% | 2,413 |
| Argyll and Bute | 85,953 | 19% | 18 | 22% | 3,429 |
| Inverclyde | 78,399 | 22% | 35 | 81% | 2,327 |
| Clackmannanshire | 51,762 | 24% | 41 | 87% | 1,343 |
| Na h-Eileanan Siar | 26,159 | 23% | 4 | 10% | 981 |
| Shetland Islands | 22,985 | 8% | 12 | 18% | 658 |
| Orkney Islands | 21,977 | 22% | 28 | 25% | 736 |
Sources: Scotland's Census 2022 (NRS) · © OpenStreetMap contributors · Ofcom Connected Nations 2025