West Midlands
West Midlands has 5,950,753 residents in 30 local authorities (Census 2021). Homes sold for a median of £255,000 over the past two years, from £160,000 in Stoke-on-Trent to £370,000 in Stratford-on-Avon.
5,950,753residentsCensus 2021
£255kmedian sale price132,123 sales, 24 months
17%green within 500 mpostcode average
90%gigabit broadbandpremises, Ofcom 2025
West Midlands by postcode sector
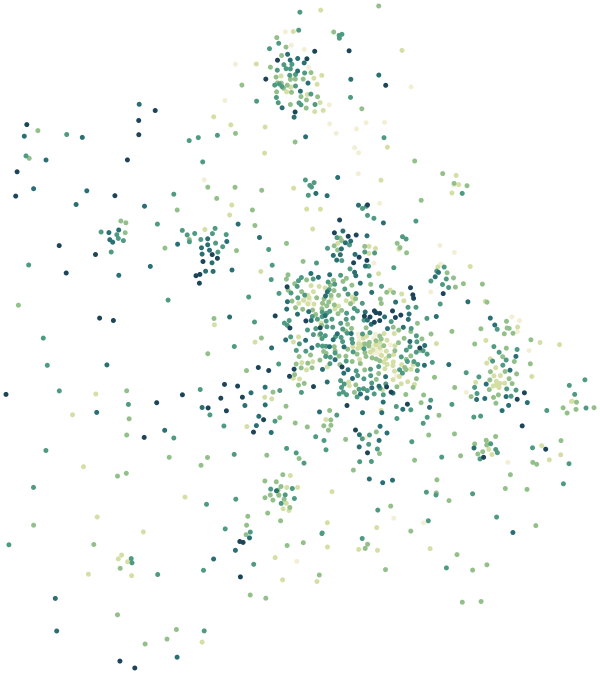
0%30%+
Average share of land within 500 m that is green space, by postcode sector
Map data © OpenStreetMap contributors · ONS Postcode Directory · HM Land Registry · IoD 2025 · Ofcom Connected Nations
Local authorities in West Midlands.
Every local authority has its own maps, a page for each ward and a report for every postcode. The greenest is Shropshire, with 23% of land near homes in green space.
| Local authority | Residents | Median price | Green 500 m | Services 15 min | Gigabit | Crime per 1,000 | Postcodes |
|---|---|---|---|---|---|---|---|
| Birmingham | 1,144,919 | £240k | 16% | 86 | 95% | 128 | 21,556 |
| Coventry | 345,325 | £230k | 14% | 73 | 97% | 104 | 6,436 |
| Sandwell | 341,832 | £220k | 17% | 108 | 96% | 106 | 6,919 |
| Shropshire | 323,606 | £275k | 23% | 23 | 74% | 59 | 12,698 |
| Dudley | 323,486 | £240k | 17% | 59 | 97% | 83 | 7,240 |
| Walsall | 284,124 | £227k | 17% | 53 | 94% | 108 | 5,579 |
| Wolverhampton | 263,727 | £223k | 12% | 65 | 98% | 106 | 5,761 |
| Stoke-on-Trent | 258,366 | £160k | 17% | 76 | 96% | 146 | 6,553 |
| Solihull | 216,240 | £333k | 15% | 54 | 96% | 90 | 4,700 |
| Herefordshire, County of | 187,034 | £295k | 13% | 10 | 84% | 63 | 6,851 |
| Telford and Wrekin | 185,541 | £235k | 22% | 59 | 88% | 94 | 5,724 |
| Warwick | 148,453 | £360k | 14% | 74 | 84% | 87 | 4,110 |
| Stafford | 136,867 | £260k | 18% | 36 | 85% | 85 | 3,892 |
| Stratford-on-Avon | 134,725 | £370k | 16% | 16 | 85% | 70 | 4,911 |
| Nuneaton and Bedworth | 134,197 | £244k | 14% | 51 | 95% | 114 | 2,725 |
| Wychavon | 132,492 | £328k | 13% | 15 | 79% | 68 | 3,926 |
| East Staffordshire | 124,020 | £240k | 10% | 45 | 79% | 82 | 3,015 |
| Newcastle-under-Lyme | 123,299 | £200k | 15% | 54 | 83% | 92 | 3,212 |
| Rugby | 114,363 | £297k | 15% | 45 | 92% | 76 | 2,923 |
| South Staffordshire | 110,472 | £290k | 19% | 23 | 83% | 62 | 3,051 |
| Lichfield | 106,436 | £312k | 14% | 25 | 84% | 72 | 3,108 |
| Worcester | 103,872 | £259k | 14% | 67 | 94% | 116 | 2,552 |
| Wyre Forest | 101,607 | £257k | 21% | 46 | 89% | 88 | 3,320 |
| Cannock Chase | 100,519 | £226k | 20% | 46 | 98% | 89 | 2,242 |
| Bromsgrove | 99,183 | £340k | 19% | 30 | 86% | 62 | 2,897 |
| Staffordshire Moorlands | 95,845 | £228k | 16% | 22 | 73% | 68 | 3,016 |
| Redditch | 87,036 | £260k | 21% | 36 | 94% | 88 | 1,658 |
| Malvern Hills | 79,486 | £332k | 18% | 15 | 72% | 59 | 2,755 |
| Tamworth | 78,646 | £248k | 15% | 46 | 95% | 83 | 1,553 |
| North Warwickshire | 65,035 | £265k | 15% | 19 | 70% | 81 | 2,003 |
Sources: Census 2021 (ONS) · HM Land Registry Price Paid Data, sales to 28 Aug 2026 · © OpenStreetMap contributors · Ofcom Connected Nations 2025 · data.police.uk