South West
South West has 5,701,158 residents in 27 local authorities (Census 2021). Homes sold for a median of £310,000 over the past two years, from £225,000 in Plymouth to £450,000 in Cotswold.
5,701,158residentsCensus 2021
£310kmedian sale price160,162 sales, 24 months
19%green within 500 mpostcode average
80%gigabit broadbandpremises, Ofcom 2025
South West by postcode sector
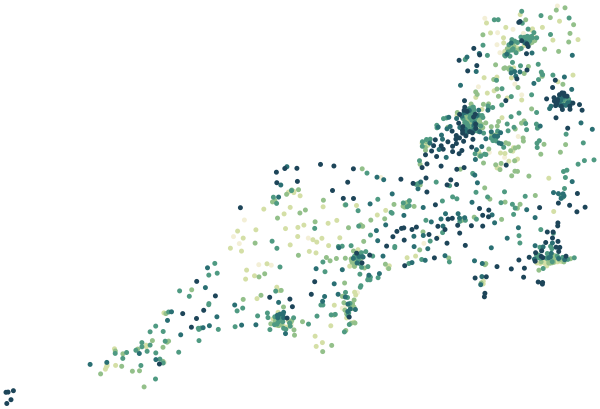
0%30%+
Average share of land within 500 m that is green space, by postcode sector
Map data © OpenStreetMap contributors · ONS Postcode Directory · HM Land Registry · IoD 2025 · Ofcom Connected Nations
Local authorities in South West.
Every local authority has its own maps, a page for each ward and a report for every postcode. The greenest is Isles of Scilly, with 44% of land near homes in green space.
| Local authority | Residents | Median price | Green 500 m | Services 15 min | Gigabit | Crime per 1,000 | Postcodes |
|---|---|---|---|---|---|---|---|
| Somerset | 571,526 | £285k | 25% | 23 | 75% | 94 | 20,408 |
| Cornwall | 570,305 | £288k | 18% | 23 | 64% | 73 | 22,065 |
| Wiltshire | 510,333 | £320k | 19% | 28 | 76% | 62 | 17,095 |
| Bristol, City of | 472,465 | £350k | 17% | 148 | 95% | 156 | 11,751 |
| Bournemouth, Christchurch and Poole | 400,196 | £339k | 14% | 89 | 90% | 90 | 9,437 |
| Dorset | 379,579 | £345k | 26% | 23 | 72% | 56 | 13,275 |
| South Gloucestershire | 290,424 | £341k | 16% | 70 | 86% | 82 | 7,266 |
| Plymouth | 264,695 | £225k | 15% | 78 | 95% | 113 | 6,293 |
| Swindon | 233,407 | £280k | 26% | 77 | 94% | 85 | 5,402 |
| North Somerset | 216,726 | £320k | 23% | 45 | 89% | 89 | 6,392 |
| Bath and North East Somerset | 193,409 | £395k | 23% | 71 | 79% | 93 | 5,930 |
| East Devon | 150,828 | £330k | 21% | 29 | 75% | 49 | 6,147 |
| Torbay | 139,324 | £250k | 15% | 94 | 89% | 110 | 3,768 |
| Teignbridge | 134,803 | £300k | 16% | 25 | 77% | 60 | 4,700 |
| Gloucester | 132,416 | £255k | 14% | 78 | 94% | – | 3,105 |
| Exeter | 130,709 | £300k | 16% | 105 | 91% | 115 | 3,626 |
| Stroud | 121,104 | £338k | 14% | 33 | 79% | – | 4,190 |
| Cheltenham | 118,836 | £328k | 16% | 150 | 93% | – | 3,889 |
| North Devon | 98,611 | £294k | 21% | 20 | 66% | 72 | 3,792 |
| Tewkesbury | 94,884 | £325k | 15% | 41 | 87% | – | 3,128 |
| Cotswold | 90,832 | £450k | 16% | 15 | 66% | – | 3,700 |
| South Hams | 88,627 | £360k | 14% | 15 | 59% | 49 | 4,243 |
| Forest of Dean | 87,004 | £275k | 27% | 15 | 79% | – | 3,311 |
| Mid Devon | 82,852 | £295k | 15% | 12 | 60% | 60 | 3,499 |
| Torridge | 68,114 | £275k | 13% | 9 | 63% | 57 | 2,803 |
| West Devon | 57,096 | £295k | 16% | 8 | 61% | 46 | 2,591 |
| Isles of Scilly | 2,053 | £428k | 44% | 43 | 51% | 45 | 94 |
Sources: Census 2021 (ONS) · HM Land Registry Price Paid Data, sales to 28 Aug 2026 · © OpenStreetMap contributors · Ofcom Connected Nations 2025 · data.police.uk (no street-level data for Gloucestershire Constabulary)