London
London has 8,799,728 residents in 33 local authorities (Census 2021). Homes sold for a median of £525,000 over the past two years, from £380,000 in Barking and Dagenham to £1,150,000 in Kensington and Chelsea.
8,799,728residentsCensus 2021
£525kmedian sale price151,249 sales, 24 months
14%green within 500 mpostcode average
91%gigabit broadbandpremises, Ofcom 2025
London by postcode sector
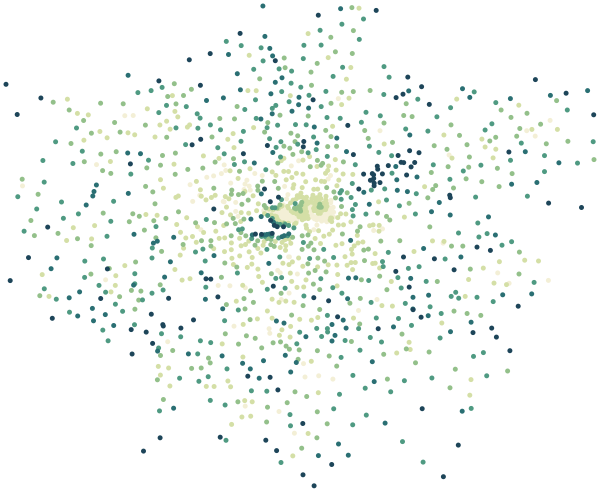
0%30%+
Average share of land within 500 m that is green space, by postcode sector
Map data © OpenStreetMap contributors · ONS Postcode Directory · HM Land Registry · IoD 2025 · Ofcom Connected Nations
Local authorities in London.
Every local authority has its own maps, a page for each ward and a report for every postcode. The greenest is Richmond upon Thames, with 21% of land near homes in green space.
| Local authority | Residents | Median price | Green 500 m | Services 15 min | Gigabit | Crime per 1,000 | Postcodes |
|---|---|---|---|---|---|---|---|
| Croydon | 390,719 | £425k | 14% | 105 | 88% | 108 | 7,052 |
| Barnet | 389,344 | £575k | 18% | 125 | 79% | 96 | 8,923 |
| Ealing | 367,115 | £530k | 14% | 152 | 91% | 120 | 6,585 |
| Newham | 351,036 | £448k | 20% | 341 | 92% | 145 | 4,391 |
| Brent | 339,816 | £550k | 10% | 133 | 85% | 127 | 5,916 |
| Bromley | 329,992 | £520k | 17% | 95 | 92% | 88 | 7,210 |
| Enfield | 329,984 | £475k | 15% | 128 | 91% | 112 | 6,272 |
| Wandsworth | 327,506 | £640k | 12% | 346 | 90% | 101 | 6,320 |
| Lambeth | 317,654 | £545k | 10% | 418 | 92% | 154 | 6,166 |
| Tower Hamlets | 310,306 | £500k | 13% | 533 | 86% | 155 | 5,933 |
| Redbridge | 310,260 | £510k | 16% | 116 | 93% | 98 | 4,618 |
| Southwark | 307,637 | £535k | 12% | 440 | 91% | 161 | 7,235 |
| Hillingdon | 305,909 | £505k | 17% | 76 | 93% | 128 | 6,167 |
| Lewisham | 300,553 | £475k | 14% | 211 | 90% | 123 | 4,987 |
| Greenwich | 289,068 | £455k | 19% | 164 | 89% | 117 | 5,238 |
| Hounslow | 288,181 | £485k | 16% | 150 | 92% | 114 | 4,931 |
| Waltham Forest | 278,426 | £538k | 17% | 279 | 95% | 106 | 3,831 |
| Haringey | 264,238 | £575k | 18% | 286 | 90% | 132 | 4,507 |
| Havering | 262,052 | £450k | 19% | 69 | 92% | 93 | 5,040 |
| Harrow | 261,203 | £550k | 12% | 114 | 90% | 85 | 4,947 |
| Hackney | 259,146 | £585k | 14% | 550 | 92% | 150 | 4,564 |
| Bexley | 246,472 | £430k | 15% | 88 | 93% | 82 | 4,406 |
| Barking and Dagenham | 218,869 | £380k | 15% | 98 | 96% | 111 | 3,069 |
| Islington | 216,589 | £640k | 8% | 632 | 95% | 191 | 6,411 |
| Merton | 215,186 | £545k | 16% | 193 | 95% | 76 | 3,690 |
| Camden | 210,136 | £770k | 10% | 682 | 95% | 222 | 8,189 |
| Sutton | 209,639 | £455k | 14% | 136 | 93% | 79 | 3,835 |
| Westminster | 204,236 | £865k | 10% | 1,169 | 87% | 421 | 13,063 |
| Richmond upon Thames | 195,278 | £720k | 21% | 227 | 90% | 74 | 4,390 |
| Hammersmith and Fulham | 183,157 | £706k | 9% | 511 | 91% | 145 | 3,677 |
| Kingston upon Thames | 168,063 | £550k | 14% | 171 | 91% | 90 | 3,509 |
| Kensington and Chelsea | 143,375 | £1.15m | 11% | 600 | 94% | 174 | 4,332 |
| City of London | 8,583 | £770k | 4% | 1,555 | 80% | 1,126 | 1,561 |
Sources: Census 2021 (ONS) · HM Land Registry Price Paid Data, sales to 28 Aug 2026 · © OpenStreetMap contributors · Ofcom Connected Nations 2025 · data.police.uk