North West
North West has 7,417,416 residents in 35 local authorities (Census 2021). Homes sold for a median of £225,000 over the past two years, from £137,000 in Burnley to £374,000 in Trafford.
7,417,416residentsCensus 2021
£225kmedian sale price184,127 sales, 24 months
16%green within 500 mpostcode average
91%gigabit broadbandpremises, Ofcom 2025
North West by postcode sector
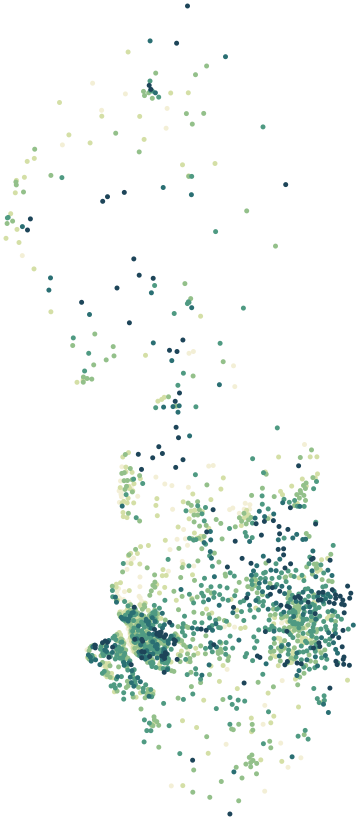
0%30%+
Average share of land within 500 m that is green space, by postcode sector
Map data © OpenStreetMap contributors · ONS Postcode Directory · HM Land Registry · IoD 2025 · Ofcom Connected Nations
Local authorities in North West.
Every local authority has its own maps, a page for each ward and a report for every postcode. The greenest is Oldham, with 28% of land near homes in green space.
| Local authority | Residents | Median price | Green 500 m | Services 15 min | Gigabit | Crime per 1,000 | Postcodes |
|---|---|---|---|---|---|---|---|
| Manchester | 551,938 | £253k | 15% | 142 | 89% | – | 14,281 |
| Liverpool | 486,088 | £185k | 14% | 100 | 91% | 143 | 10,620 |
| Cheshire East | 398,772 | £300k | 15% | 52 | 84% | 71 | 12,337 |
| Cheshire West and Chester | 357,150 | £265k | 14% | 42 | 89% | 76 | 11,026 |
| Wigan | 329,330 | £200k | 18% | 64 | 97% | – | 7,961 |
| Wirral | 320,199 | £223k | 17% | 71 | 96% | 81 | 8,693 |
| Bolton | 295,963 | £210k | 18% | 90 | 97% | – | 7,298 |
| Stockport | 294,773 | £310k | 20% | 95 | 96% | – | 6,797 |
| Sefton | 279,233 | £230k | 11% | 65 | 81% | 87 | 6,704 |
| Cumberland | 273,276 | £177k | 15% | 29 | 75% | 84 | 10,485 |
| Salford | 269,923 | £235k | 18% | 95 | 94% | – | 6,708 |
| Oldham | 242,088 | £211k | 28% | 92 | 98% | – | 5,905 |
| Trafford | 235,052 | £374k | 14% | 121 | 94% | – | 6,473 |
| Tameside | 231,071 | £220k | 21% | 73 | 96% | – | 6,023 |
| Westmorland and Furness | 226,589 | £240k | 17% | 28 | 79% | 73 | 9,547 |
| Rochdale | 223,773 | £211k | 16% | 53 | 90% | – | 5,780 |
| Warrington | 210,974 | £260k | 16% | 74 | 97% | 76 | 5,476 |
| Bury | 193,851 | £250k | 21% | 68 | 95% | – | 5,003 |
| St. Helens | 183,248 | £193k | 17% | 59 | 97% | 98 | 4,854 |
| Blackburn with Darwen | 154,738 | £172k | 15% | 64 | 92% | 115 | 3,461 |
| Knowsley | 154,519 | £197k | 20% | 56 | 98% | 97 | 3,813 |
| Preston | 147,835 | £200k | 11% | 84 | 88% | 140 | 3,638 |
| Lancaster | 142,934 | £203k | 21% | 70 | 90% | 98 | 4,265 |
| Blackpool | 141,036 | £139k | 8% | 100 | 91% | 187 | 3,499 |
| Halton | 128,478 | £195k | 16% | 56 | 97% | 94 | 3,165 |
| Chorley | 117,732 | £225k | 17% | 49 | 92% | 81 | 2,932 |
| West Lancashire | 117,429 | £248k | 12% | 33 | 81% | 64 | 2,825 |
| Wyre | 111,946 | £200k | 18% | 55 | 91% | 83 | 3,244 |
| South Ribble | 111,035 | £220k | 12% | 51 | 84% | 80 | 2,684 |
| Pendle | 95,757 | £148k | 10% | 63 | 94% | 96 | 2,966 |
| Burnley | 94,646 | £137k | 18% | 63 | 96% | 148 | 2,402 |
| Hyndburn | 82,234 | £140k | 24% | 59 | 95% | 130 | 2,004 |
| Fylde | 81,374 | £245k | 10% | 52 | 93% | 75 | 2,355 |
| Rossendale | 70,871 | £190k | 25% | 28 | 94% | 90 | 2,436 |
| Ribble Valley | 61,561 | £277k | 10% | 15 | 85% | 54 | 2,045 |
Sources: Census 2021 (ONS) · HM Land Registry Price Paid Data, sales to 28 Aug 2026 · © OpenStreetMap contributors · Ofcom Connected Nations 2025 · data.police.uk (no street-level data for Greater Manchester Police)