South East
South East has 9,278,067 residents in 64 local authorities (Census 2021). Homes sold for a median of £383,500 over the past two years, from £255,000 in Gosport to £651,500 in Elmbridge.
9,278,067residentsCensus 2021
£384kmedian sale price240,317 sales, 24 months
21%green within 500 mpostcode average
85%gigabit broadbandpremises, Ofcom 2025
South East by postcode sector
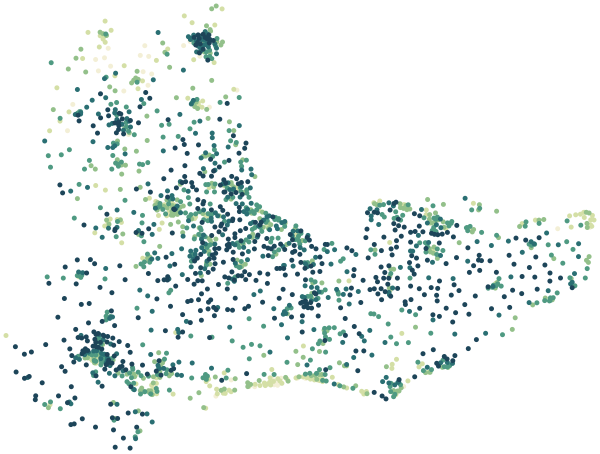
0%30%+
Average share of land within 500 m that is green space, by postcode sector
Map data © OpenStreetMap contributors · ONS Postcode Directory · HM Land Registry · IoD 2025 · Ofcom Connected Nations
Local authorities in South East.
Every local authority has its own maps, a page for each ward and a report for every postcode. The greenest is New Forest, with 35% of land near homes in green space.
| Local authority | Residents | Median price | Green 500 m | Services 15 min | Gigabit | Crime per 1,000 | Postcodes |
|---|---|---|---|---|---|---|---|
| Buckinghamshire | 553,078 | £460k | 22% | 43 | 81% | 65 | 16,137 |
| Milton Keynes | 287,060 | £350k | 23% | 85 | 96% | 107 | 7,876 |
| Medway | 279,773 | £312k | 17% | 74 | 92% | 107 | 6,188 |
| Brighton and Hove | 277,103 | £417k | 12% | 187 | 85% | 128 | 5,079 |
| Southampton | 248,922 | £261k | 16% | 116 | 97% | 139 | 5,814 |
| Portsmouth | 208,003 | £258k | 10% | 190 | 97% | 129 | 4,427 |
| Basingstoke and Deane | 185,154 | £373k | 21% | 39 | 82% | 73 | 5,077 |
| Wokingham | 177,503 | £490k | 17% | 46 | 93% | 49 | 4,478 |
| New Forest | 175,785 | £383k | 35% | 39 | 74% | 58 | 5,521 |
| Maidstone | 175,782 | £368k | 24% | 34 | 81% | 93 | 5,447 |
| Reading | 174,224 | £350k | 13% | 117 | 96% | 118 | 3,794 |
| Arun | 164,889 | £345k | 10% | 60 | 75% | 92 | 5,194 |
| Oxford | 162,040 | £450k | 23% | 178 | 80% | 110 | 3,697 |
| West Berkshire | 161,448 | £398k | 17% | 31 | 88% | 67 | 5,434 |
| Cherwell | 161,016 | £356k | 12% | 38 | 89% | 76 | 4,932 |
| Wealden | 160,152 | £382k | 23% | 22 | 69% | 57 | 6,055 |
| Slough | 158,500 | £395k | 16% | 86 | 97% | 109 | 2,883 |
| Canterbury | 157,432 | £348k | 20% | 60 | 73% | 111 | 4,564 |
| Windsor and Maidenhead | 153,496 | £538k | 21% | 57 | 86% | 68 | 4,541 |
| Mid Sussex | 152,566 | £440k | 20% | 56 | 82% | 65 | 4,616 |
| Swale | 151,676 | £310k | 18% | 40 | 82% | 104 | 4,115 |
| Reigate and Banstead | 150,846 | £480k | 23% | 64 | 88% | 74 | 3,914 |
| South Oxfordshire | 149,085 | £450k | 22% | 28 | 82% | 50 | 5,324 |
| Horsham | 146,778 | £435k | 22% | 45 | 76% | 59 | 4,232 |
| Guildford | 143,650 | £500k | 30% | 47 | 81% | 85 | 4,316 |
| Thanet | 140,587 | £294k | 9% | 93 | 81% | 117 | 4,050 |
| Isle of Wight | 140,459 | £260k | 31% | 52 | 87% | 84 | 5,135 |
| Vale of White Horse | 138,913 | £398k | 20% | 34 | 87% | 57 | 4,301 |
| Elmbridge | 138,754 | £652k | 18% | 85 | 86% | 63 | 3,836 |
| Eastleigh | 136,443 | £345k | 24% | 52 | 90% | 69 | 3,467 |
| Ashford | 132,747 | £345k | 31% | 24 | 75% | 82 | 3,975 |
| Tonbridge and Malling | 132,201 | £415k | 26% | 30 | 85% | 70 | 4,043 |
| Test Valley | 130,492 | £365k | 35% | 33 | 77% | 63 | 3,842 |
| Waverley | 128,229 | £548k | 33% | 46 | 71% | 46 | 4,376 |
| Winchester | 127,444 | £460k | 29% | 29 | 64% | 66 | 4,213 |
| East Hampshire | 125,744 | £423k | 31% | 25 | 74% | 49 | 4,234 |
| Bracknell Forest | 124,607 | £420k | 21% | 52 | 97% | 69 | 3,065 |
| Havant | 124,208 | £320k | 17% | 59 | 95% | 90 | 3,108 |
| Chichester | 124,068 | £421k | 18% | 27 | 67% | 84 | 4,974 |
| Sevenoaks | 120,514 | £482k | 31% | 30 | 76% | 64 | 3,714 |
| Crawley | 118,493 | £350k | 28% | 81 | 95% | 136 | 2,674 |
| Dartford | 116,753 | £377k | 20% | 61 | 84% | 115 | 2,462 |
| Dover | 116,410 | £293k | 21% | 30 | 80% | 90 | 3,933 |
| Tunbridge Wells | 115,311 | £435k | 33% | 36 | 81% | 70 | 3,891 |
| Fareham | 114,511 | £345k | 19% | 51 | 98% | 62 | 3,314 |
| West Oxfordshire | 114,237 | £395k | 18% | 26 | 93% | 52 | 4,117 |
| Worthing | 111,338 | £350k | 6% | 96 | 98% | 104 | 3,136 |
| Folkestone and Hythe | 109,758 | £317k | 21% | 57 | 78% | 88 | 3,682 |
| Gravesham | 106,900 | £362k | 17% | 81 | 83% | 96 | 2,272 |
| Woking | 103,943 | £447k | 22% | 72 | 92% | 74 | 2,589 |
| Spelthorne | 102,956 | £462k | 18% | 85 | 93% | 90 | 2,490 |
| Eastbourne | 101,686 | £275k | 14% | 79 | 87% | 144 | 2,861 |
| Lewes | 99,905 | £385k | 15% | 39 | 71% | 75 | 3,393 |
| Rushmoor | 99,756 | £362k | 18% | 88 | 96% | 83 | 2,345 |
| Hart | 99,408 | £460k | 25% | 46 | 87% | 46 | 2,973 |
| Rother | 93,108 | £360k | 25% | 20 | 71% | 74 | 3,172 |
| Hastings | 90,995 | £280k | 21% | 74 | 76% | 147 | 2,030 |
| Surrey Heath | 90,453 | £477k | 26% | 42 | 89% | 65 | 2,357 |
| Runnymede | 88,079 | £460k | 26% | 79 | 86% | 90 | 2,424 |
| Tandridge | 87,876 | £495k | 24% | 35 | 71% | 73 | 2,344 |
| Mole Valley | 87,386 | £580k | 31% | 54 | 79% | 66 | 3,146 |
| Gosport | 81,952 | £255k | 15% | 71 | 98% | 81 | 1,840 |
| Epsom and Ewell | 80,938 | £544k | 20% | 75 | 96% | 88 | 1,892 |
| Adur | 64,544 | £378k | 10% | 92 | 96% | 71 | 1,853 |
Sources: Census 2021 (ONS) · HM Land Registry Price Paid Data, sales to 28 Aug 2026 · © OpenStreetMap contributors · Ofcom Connected Nations 2025 · data.police.uk