East Midlands
East Midlands has 4,880,058 residents in 35 local authorities (Census 2021). Homes sold for a median of £250,000 over the past two years, from £184,000 in Bolsover to £342,000 in Rushcliffe.
4,880,058residentsCensus 2021
£250kmedian sale price128,801 sales, 24 months
13%green within 500 mpostcode average
89%gigabit broadbandpremises, Ofcom 2025
East Midlands by postcode sector
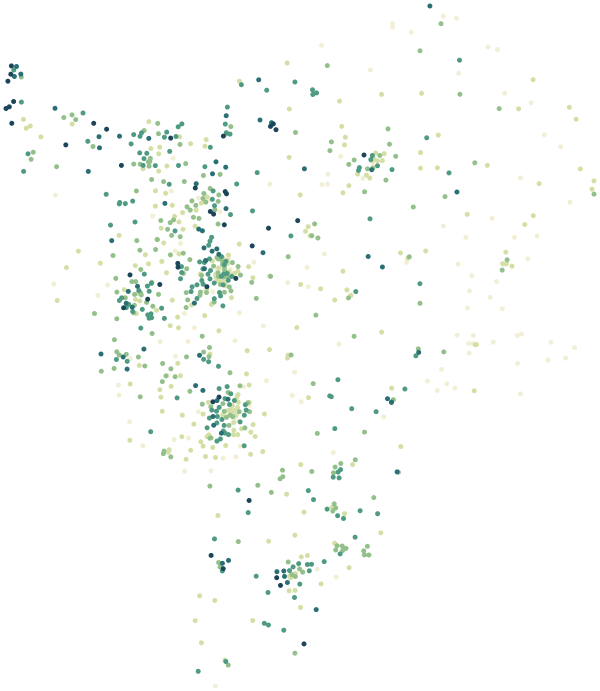
0%30%+
Average share of land within 500 m that is green space, by postcode sector
Map data © OpenStreetMap contributors · ONS Postcode Directory · HM Land Registry · IoD 2025 · Ofcom Connected Nations
Local authorities in East Midlands.
Every local authority has its own maps, a page for each ward and a report for every postcode. The greenest is High Peak, with 23% of land near homes in green space.
| Local authority | Residents | Median price | Green 500 m | Services 15 min | Gigabit | Crime per 1,000 | Postcodes |
|---|---|---|---|---|---|---|---|
| West Northamptonshire | 425,725 | £300k | 16% | 40 | 95% | 96 | 9,895 |
| Leicester | 368,571 | £244k | 13% | 100 | 97% | 129 | 6,098 |
| North Northamptonshire | 359,525 | £265k | 14% | 49 | 96% | 91 | 8,591 |
| Nottingham | 323,632 | £200k | 13% | 150 | 97% | 161 | 6,787 |
| Derby | 261,364 | £220k | 15% | 90 | 98% | 140 | 5,570 |
| Charnwood | 183,971 | £275k | 14% | 47 | 85% | 82 | 3,890 |
| South Kesteven | 143,404 | £265k | 12% | 24 | 82% | 77 | 4,217 |
| East Lindsey | 142,296 | £216k | 7% | 16 | 61% | 101 | 5,289 |
| Ashfield | 126,300 | £200k | 15% | 62 | 95% | 103 | 2,751 |
| Amber Valley | 126,206 | £233k | 11% | 44 | 90% | 84 | 2,950 |
| Newark and Sherwood | 122,956 | £240k | 15% | 25 | 84% | 88 | 3,673 |
| Rushcliffe | 119,077 | £342k | 11% | 51 | 82% | 59 | 3,045 |
| North Kesteven | 118,075 | £242k | 10% | 20 | 83% | 57 | 3,438 |
| Bassetlaw | 117,804 | £210k | 21% | 19 | 78% | 103 | 3,929 |
| Gedling | 117,264 | £250k | 10% | 93 | 94% | 71 | 2,715 |
| Hinckley and Bosworth | 113,642 | £265k | 10% | 33 | 81% | 68 | 2,656 |
| Erewash | 112,906 | £218k | 13% | 72 | 96% | 93 | 2,442 |
| Broxtowe | 110,940 | £254k | 15% | 83 | 96% | 83 | 2,622 |
| Mansfield | 110,482 | £191k | 14% | 65 | 96% | 120 | 2,673 |
| South Derbyshire | 107,205 | £260k | 15% | 37 | 90% | 68 | 2,648 |
| North West Leicestershire | 104,706 | £273k | 11% | 28 | 88% | 75 | 2,682 |
| Lincoln | 103,813 | £188k | 14% | 78 | 92% | 161 | 2,514 |
| Chesterfield | 103,569 | £200k | 14% | 58 | 93% | 125 | 2,903 |
| Blaby | 102,926 | £282k | 13% | 46 | 92% | 74 | 2,360 |
| North East Derbyshire | 102,001 | £245k | 13% | 27 | 89% | 73 | 2,784 |
| Harborough | 97,625 | £333k | 10% | 24 | 81% | 56 | 2,677 |
| West Lindsey | 95,156 | £230k | 11% | 12 | 67% | 86 | 3,320 |
| South Holland | 95,122 | £239k | 4% | 17 | 76% | 83 | 2,865 |
| High Peak | 90,933 | £264k | 23% | 57 | 80% | 73 | 2,888 |
| Bolsover | 80,272 | £184k | 11% | 29 | 93% | 88 | 2,109 |
| Derbyshire Dales | 71,540 | £320k | 19% | 17 | 59% | 56 | 2,300 |
| Boston | 70,502 | £205k | 6% | 21 | 79% | 111 | 2,105 |
| Oadby and Wigston | 57,747 | £280k | 12% | 85 | 99% | 65 | 1,215 |
| Melton | 51,752 | £270k | 7% | 15 | 80% | 70 | 1,592 |
| Rutland | 41,049 | £340k | 16% | 13 | 78% | 48 | 1,284 |
Sources: Census 2021 (ONS) · HM Land Registry Price Paid Data, sales to 28 Aug 2026 · © OpenStreetMap contributors · Ofcom Connected Nations 2025 · data.police.uk