Plumstead & Glyndon
Plumstead & Glyndon is one of 23 wards in Greenwich, home to 21,348 people in 7,360 households (Census 2021). Homes sold for a median of £411,250 over the past two years, 10% below the Greenwich median. On average 13% of the land within 500 metres of a home postcode is green space — 29% below the Greenwich average.

People and homes.
21,348 residents in 7,360 households, next to the Greenwich average.
Source: Census 2021, Office for National Statistics
Prices.
Quarterly median of standard sales in Plumstead & Glyndon and Greenwich.
Source: HM Land Registry Price Paid Data, sales to 28 Aug 2026
Safety.
Police recorded 3,146 crimes and incidents in Plumstead & Glyndon in the 12 months to Aug 2026: 147 per 1,000 residents, against 117 across Greenwich.
Police.uk records crimes by approximate location, not by where victims or offenders live. Busy streets, shops, stations and nightlife record more. Figures are counts, not a measure of personal risk. Rates per resident are higher wherever many people visit but few live, such as city centres.
Source: data.police.uk street-level crime, Metropolitan Police Service (Open Government Licence v3.0)
Food hygiene.
Food businesses in Plumstead & Glyndon with a published hygiene rating.
Council food safety officers rate businesses from 0 (urgent improvement necessary) to 5 (very good) for hygiene, the state of the premises and how food safety is managed. A rating reflects the standards found on the day of inspection, not the quality of the food.
Source: Food Standards Agency, food hygiene rating data as of 26 October 2026 (Open Government Licence)
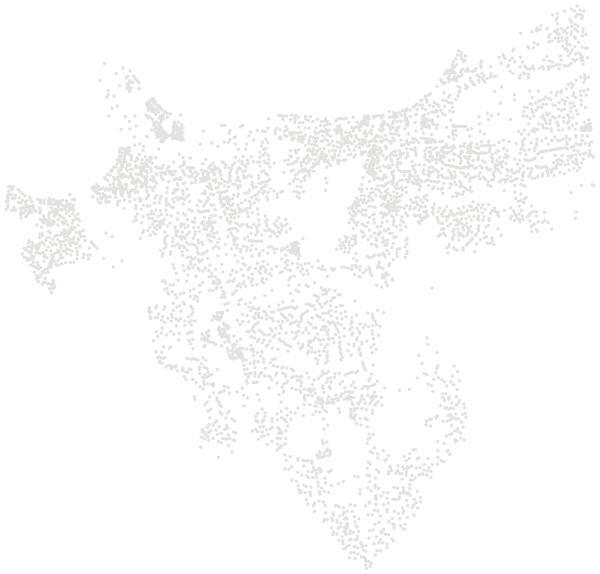
Every postcode in Plumstead & Glyndon.
292 postcodes, each with its own report. Figures show green space within 500 m; “business” marks postcodes used mainly by a single large organisation.