North Northamptonshire
North Northamptonshire has 359,525 residents in 148,918 households (Census 2021); 17% are aged 15–29 and 34% of households rent their home. Over the past two years homes sold for a median of £265,000, from £165,000 in Kettering Central to £400,000 in Oundle.
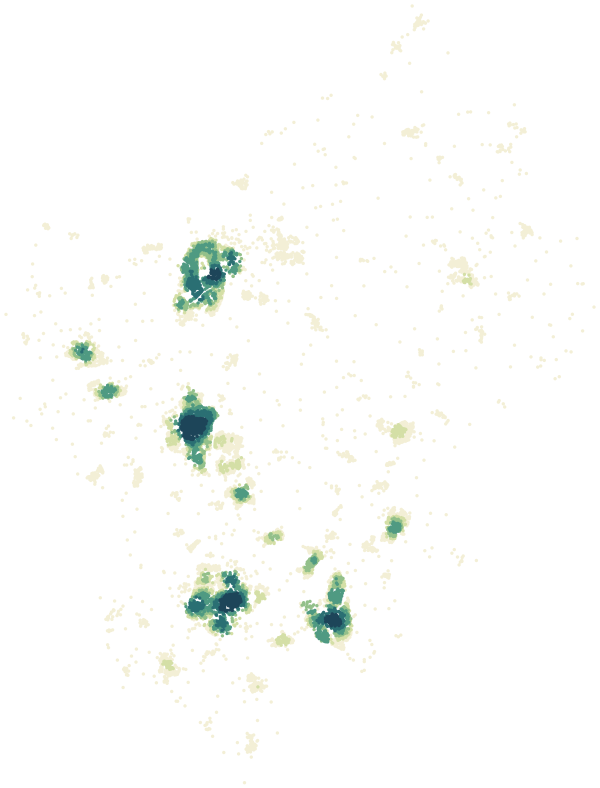
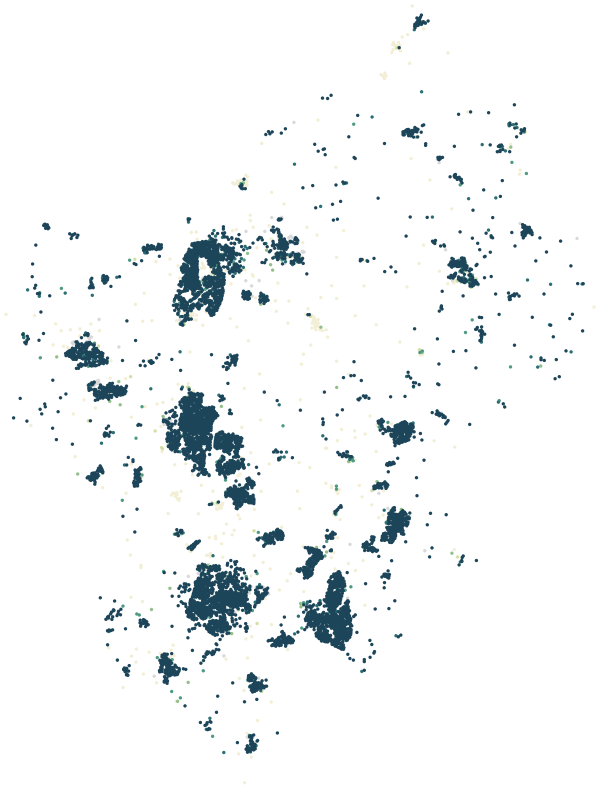
Six maps of North Northamptonshire.
Every dot is a residential postcode. Each map uses the same colour scale, from lowest to highest.
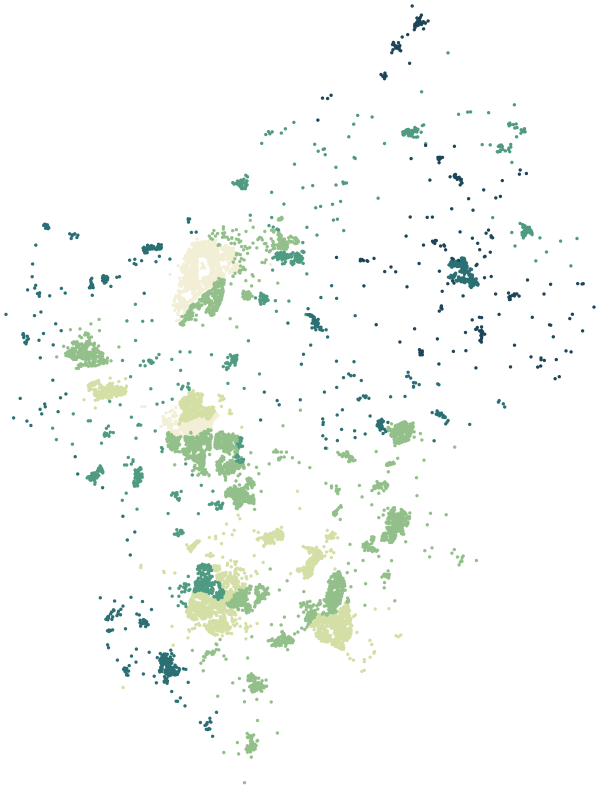
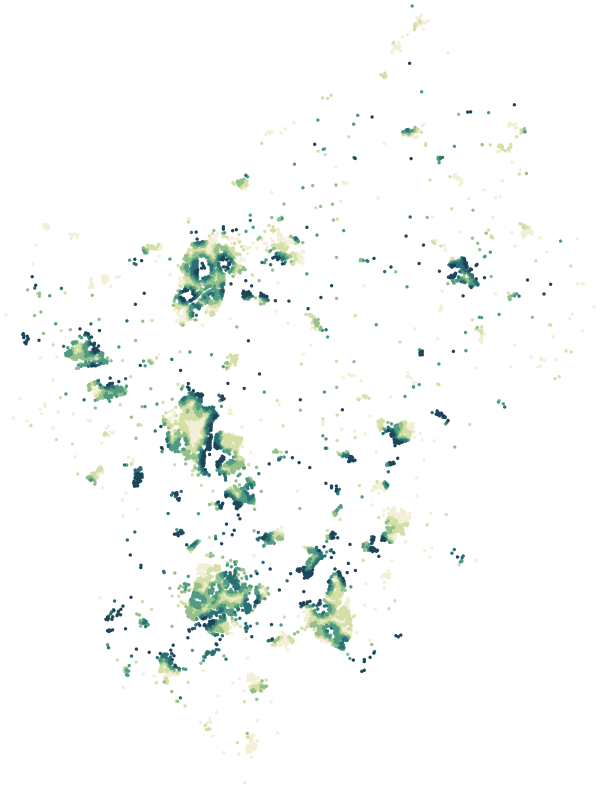
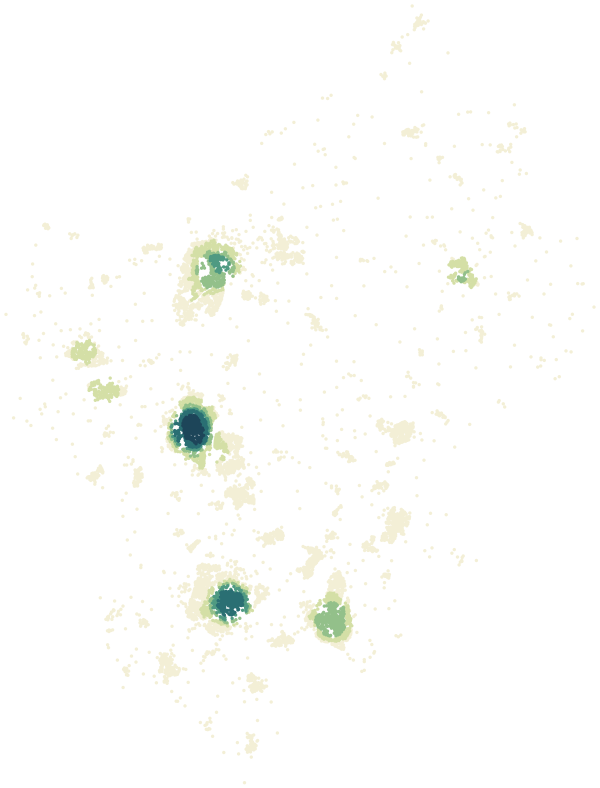
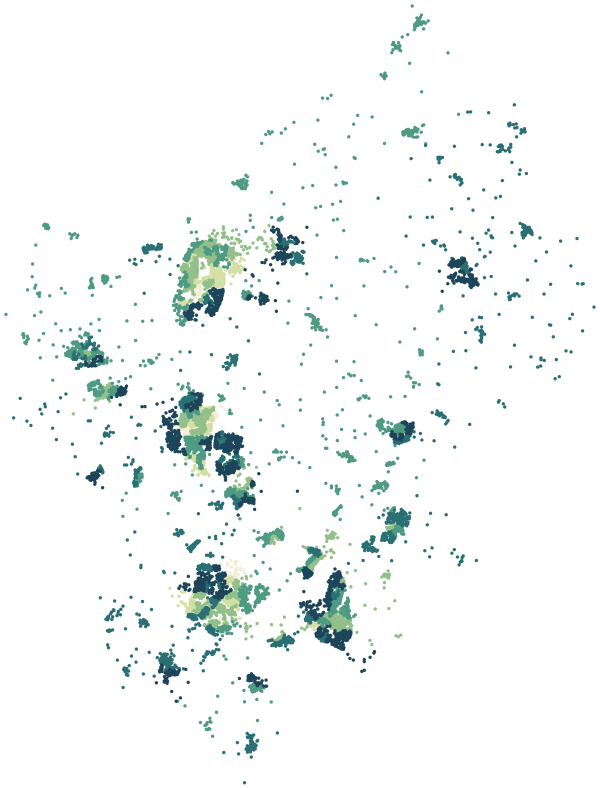
Sources: ONS Postcode Directory, Aug 2026 · HM Land Registry Price Paid Data · © OpenStreetMap contributors · English Indices of Deprivation 2025, MHCLG · data.police.uk · Ofcom Connected Nations 2025
All 31 wards at a glance.
Colour shows where each ward sits among North Northamptonshire's wards for that measure, from lowest to highest. Select a ward for its full report.
| Ward | Median price | Green 500 m | Services 15 min | Aged 15–29 | Owner-occupied | Flats | Nearest tram or rail | Gigabit | Crime per 1,000 |
|---|---|---|---|---|---|---|---|---|---|
| Avondale Grange | £208k | 18% | 94 | 19% | 42% | 18% | 2.3 km | 98% | 122 |
| Barton Seagrave & Burton Latimer | £277k | 18% | 42 | 17% | 73% | 4% | 2.6 km | 94% | 59 |
| Brickhill & Queensway | £249k | 15% | 62 | 17% | 53% | 16% | 2.8 km | 100% | 145 |
| Corby West | £200k | 13% | 69 | 17% | 59% | 14% | 2.1 km | 89% | 102 |
| Croyland & Swanspool | £225k | 12% | 187 | 19% | 50% | 16% | 1.5 km | 97% | 174 |
| Desborough | £295k | 15% | 46 | 15% | 76% | 4% | 6.8 km | 92% | 73 |
| Earls Barton | £320k | 20% | 15 | 14% | 78% | 3% | 6.5 km | 77% | 57 |
| Finedon | £232k | 17% | 33 | 16% | 64% | 10% | 4.2 km | 89% | 90 |
| Geddington & Stanion | £304k | 22% | 7 | 14% | 72% | 6% | 3.3 km | 84% | 77 |
| Gretton & Weldon | £295k | 10% | 17 | 17% | 76% | 3% | 4.0 km | 78% | 50 |
| Hatton Park | £299k | 12% | 39 | 16% | 74% | 5% | 2.6 km | 99% | 67 |
| Higham Ferrers | £275k | 11% | 50 | 16% | 73% | 4% | 5.7 km | 97% | 76 |
| Irchester | £290k | 8% | 19 | 13% | 75% | 4% | 5.0 km | 91% | 52 |
| Irthlingborough | £231k | 25% | 41 | 17% | 67% | 9% | 5.0 km | 87% | 71 |
| Ise | £290k | 16% | 51 | 16% | 79% | 4% | 1.2 km | 100% | 87 |
| Kettering Central | £165k | 4% | 257 | 22% | 37% | 29% | 1.1 km | 93% | 224 |
| Kettering North | £256k | 14% | 99 | 17% | 68% | 8% | 2.3 km | 98% | 80 |
| Kingswood | £190k | 15% | 58 | 19% | 51% | 13% | 2.4 km | 96% | 113 |
| Lloyds & Corby Village | £195k | 14% | 98 | 18% | 51% | 12% | 1.1 km | 92% | 148 |
| Oakley | £250k | 14% | 34 | 17% | 68% | 6% | 2.9 km | 89% | 62 |
| Oundle | £400k | 15% | 11 | 15% | 70% | 3% | 7.9 km | 82% | 47 |
| Pemberton | £235k | 9% | 102 | 16% | 70% | 7% | 4.8 km | 99% | 108 |
| Pipers Hill | £245k | 18% | 184 | 16% | 68% | 12% | 1.1 km | 99% | 98 |
| Raunds | £270k | 11% | 41 | 15% | 75% | 4% | 10.5 km | 94% | 67 |
| Rothwell & Mawsley | £261k | 16% | 21 | 15% | 70% | 7% | 5.5 km | 85% | 65 |
| Rushden Lakes | £216k | 10% | 112 | 18% | 59% | 14% | 5.6 km | 96% | 147 |
| Rushden South | £275k | 14% | 87 | 16% | 75% | 9% | 6.2 km | 98% | 69 |
| St Michael | £226k | 9% | 164 | 18% | 57% | 19% | 705 m | 99% | 69 |
| St Peter | £271k | 12% | 77 | 17% | 68% | 10% | 959 m | 92% | 84 |
| Thrapston | £300k | 16% | 15 | 15% | 70% | 4% | 11.7 km | 78% | 52 |
| Victoria | £275k | 14% | 138 | 20% | 48% | 16% | 741 m | 96% | 107 |
Sources: Census 2021 · HM Land Registry Price Paid Data, sales to 28 Aug 2026 · © OpenStreetMap contributors · data.police.uk
Prices.
Quarterly median of all standard residential sales in North Northamptonshire. The latest quarter is still being registered.
Source: HM Land Registry Price Paid Data, sales to 28 Aug 2026
Safety.
Police recorded 32,796 crimes and incidents in North Northamptonshire in the 12 months to Aug 2026, 91 per 1,000 residents.
Police.uk records crimes by approximate location, not by where victims or offenders live. Busy streets, shops, stations and nightlife record more. Figures are counts, not a measure of personal risk.
Source: data.police.uk street-level crime, Northamptonshire Police (Open Government Licence v3.0)
Road safety.
Injury collisions reported to the police in North Northamptonshire each year, 2021–2025: 647 of them with a serious or fatal injury.
Counts include only collisions involving personal injury that were reported to the police. Most happen on main roads and at junctions, so a count near a postcode reflects the traffic passing through, not the risk of any one journey.
Source: Department for Transport, STATS19 road safety data (Open Government Licence v3.0)
Food hygiene.
Food businesses in North Northamptonshire with a published hygiene rating.
Council food safety officers rate businesses from 0 (urgent improvement necessary) to 5 (very good) for hygiene, the state of the premises and how food safety is managed. A rating reflects the standards found on the day of inspection, not the quality of the food.
Source: Food Standards Agency, food hygiene rating data as of 26 October 2026 (Open Government Licence)
Broadband.
Share of homes in North Northamptonshire that can get each type of fixed broadband, July 2025.
Source: Ofcom Connected Nations 2025, fixed broadband coverage of residential premises, July 2025. © Ofcom copyright
Deprivation, in context.
9 of North Northamptonshire's 205 neighbourhoods are in the most deprived tenth of England on the 2025 index.
The English Indices of Deprivation rank 33,755 small areas from 1 (most deprived 10%) to 10 (least deprived). They describe areas relative to each other, not every household in them.
Source: English Indices of Deprivation 2025, MHCLG
Wards of North Northamptonshire.
Every ward has its own page with all of its postcodes.